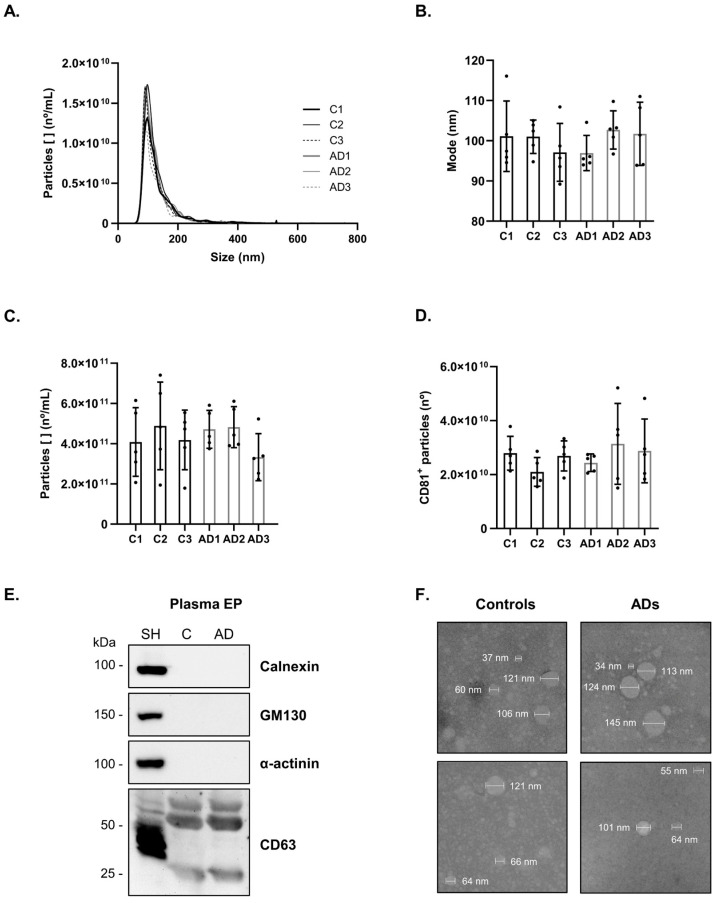
Figure 1.
Characterization of bdEP from Controls and AD cases. bdEP batches (C1–C3 and AD1–AD3) size distribution (A), mode size (B), and particle concentration (C) were determined by Nanoparticle Tracking Analysis. The number of nanovesicles positive for surface marker CD81 (D) was determined by ELISA. Black dots represent sample measures for each pool. Western blot analysis (E) of the EVs marker CD63 and the negative markers Calnexin, GM130, and α-actinin. Transmission Electron Microscopy of isolated nanovesicles (F) from Controls or AD cases. Abbreviations: AD, Alzheimer’s disease; C, Controls; SH, SH-SY5Y cell lysates.

