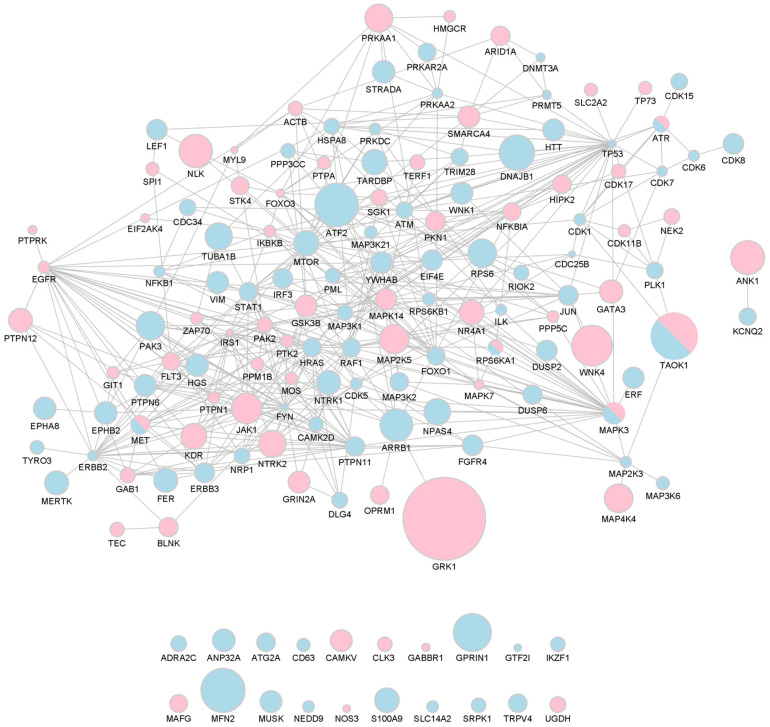
Figure 4.
Network of bdEP proteins significantly altered in AD. Size nodes were adjusted according to %CFC. Proteins that were decreased in bdEP of AD cases are represented as blue nodes; those that were increased are represented as pink nodes; and proteins in which opposite patterns were found are represented in both colors. This network was created using STRING and imported to Cytoscape v3.9.1.

