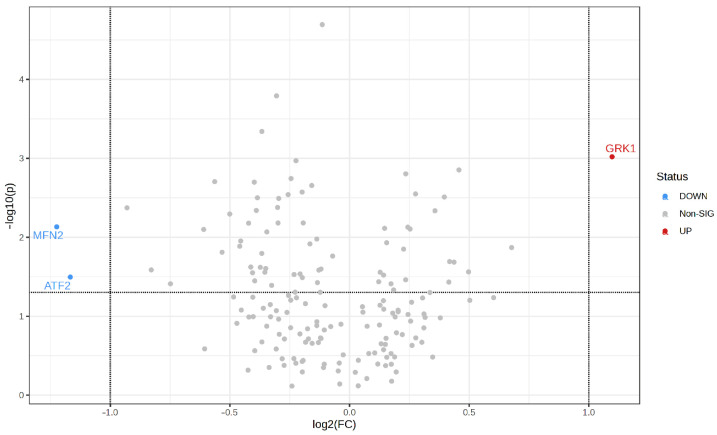
Figure 5.
Volcano plot of total proteome in bdEP of AD cases. Y axis represents statistical significance (−log10(p-value)), and X axis shows fold-change alteration (log2FC) in normalized signal intensity of proteins. Red dot indicates a statistically significantly increased protein, and blue dots depict decreased proteins between bdEP of Controls and AD cases. Horizontal dashed line indicates a p-value threshold of p ≤ 0.05, and vertical line represents the AD/Controls fold-change threshold of >2 (log2FC > 1 or <−1). Volcano plot was constructed on MetaboAnalyst 5.0. Abbreviations: FC, fold-change; p, p-value; sig, significant.

