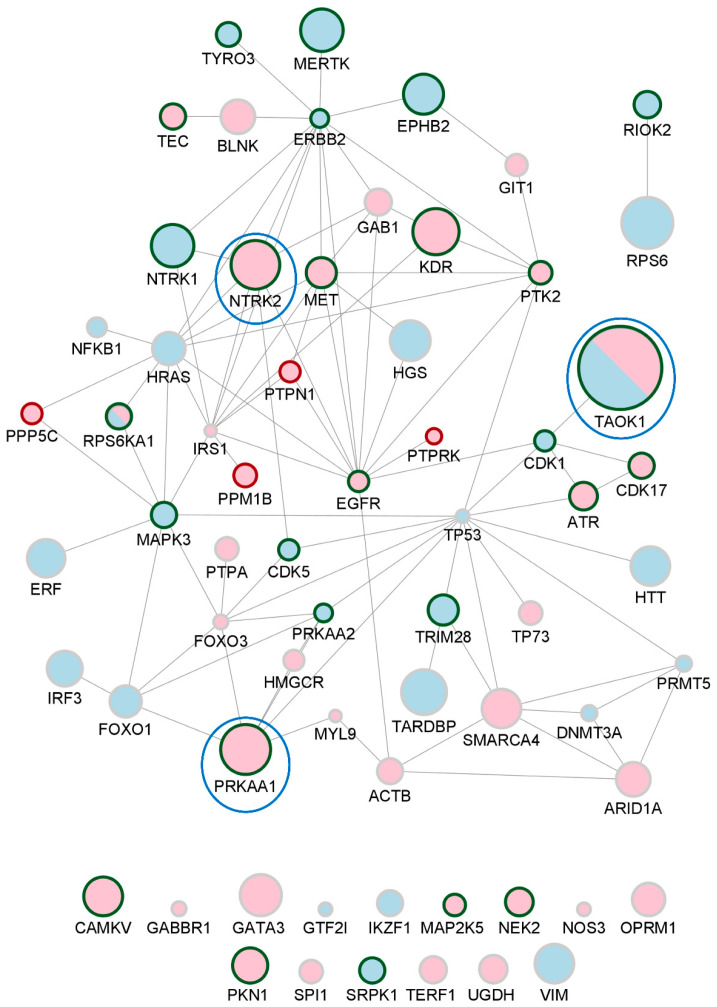
Figure 6.
Network of bdEP phosphoproteins significantly altered in AD. Size nodes were adjusted according to %CFC, and top 3 nodes with higher %CFC are surrounded by a blue circle. Phosphoproteins that were increased in bdEP of AD cases are represented as pink nodes; decreased phosphoproteins are represented as blue nodes. For TAOK1 and RPS6KA1, phosphorylated residues were found to be increased or decreased, and, thus, these phosphoproteins are represented in both colors. Kinases and phosphatases are highlighted by node border colors of green or red, respectively. These phosphoprotein networks were created using STRING and imported to Cytoscape v3.9.1.

