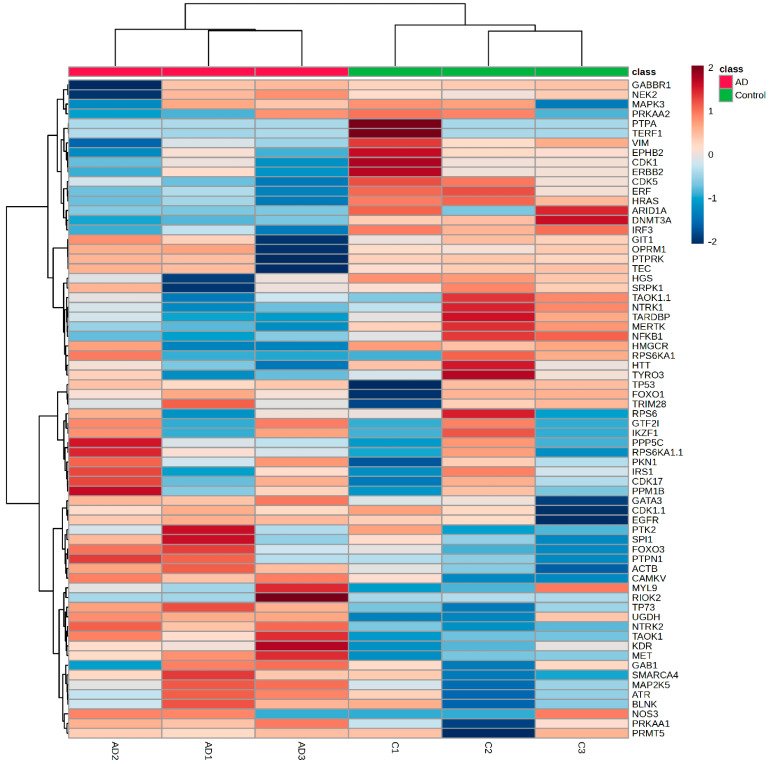
Figure 7.
Heatmap for phosphoproteins that significantly changed between the bdEP of Controls and AD cases. Heatmap was constructed on MetaboAnalyst. The bars on the top of heatmap show each batch of Controls (C1–C3) or AD cases (AD1–AD3). Red represents higher signal intensity, and blue represents lower signal intensity.

