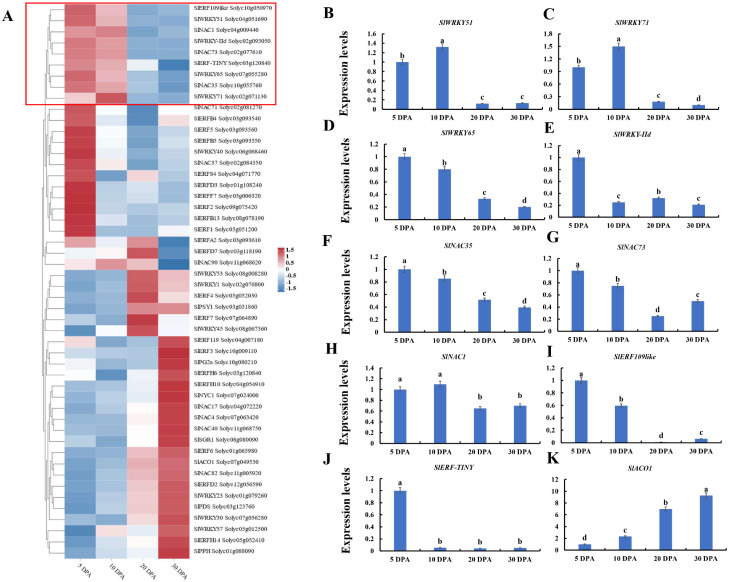
Figure 1.
Screening differentially expressed genes (DEGs) from a high-resolution spatiotemporal transcriptome (Shinozaki et al., 2018) [21], and analysis of the expression levels by RT-qPCR. (A) Heatmap of the candidate DEGs related to ripening in tomato at 5, 10, 20, and 30 DPA (days post anthesis). The expression levels of (B) SlWRKY51, (C) SlWRKY71, (D) SlWRKY65, (E) SlWRKY-IId, (F) SlNAC35, (G) SlNAC73, (H) SlNAC1, (I) SlERF109like, (J) SlERF-TINY, and (K) ACO1 were analyzed using Rt-qPCR in tomato fruits at 5, 10, 20, and 30 DPA. Data are presented as means ± SD (n = 3). Different letters above the columns stand for significant differences between two values (p < 0.05) at the same time point.

