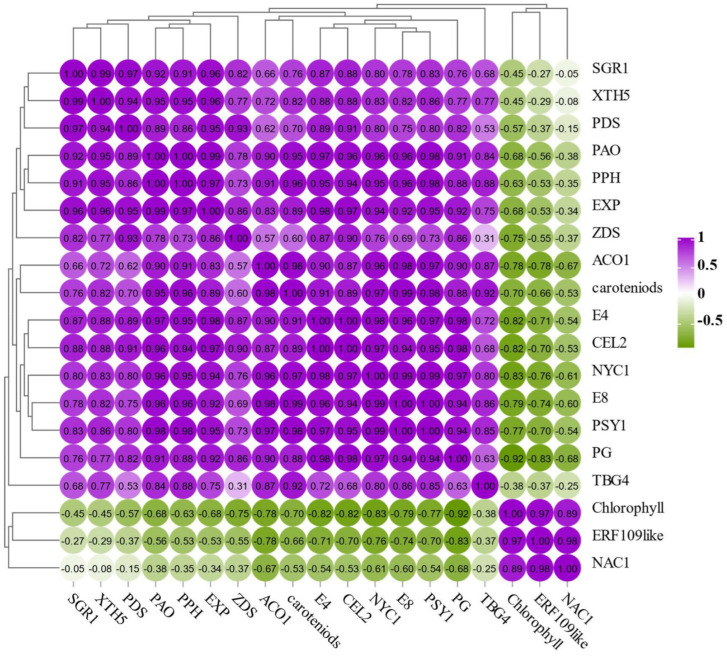
Figure 9.
Correlation analysis of chlorophyll, carotenoid contents, and gene expressions of NYC1, PAO, PPH, SGR1, PSY1, PDS, ZDS, E4, ACO1, E8, SlNAC1, SlERF109-like, PG, XTH5, TBG4, EXP, and CEL2, based on control (TRV) and SlERF109-like-silenced fruit (TRV-SlERF109-like) at 21 and 27 DPI, and on control (pSAK277) and SlERF109-like-overexpressed (pSAK277-SlERF109-like) fruit at 7 DPI.

