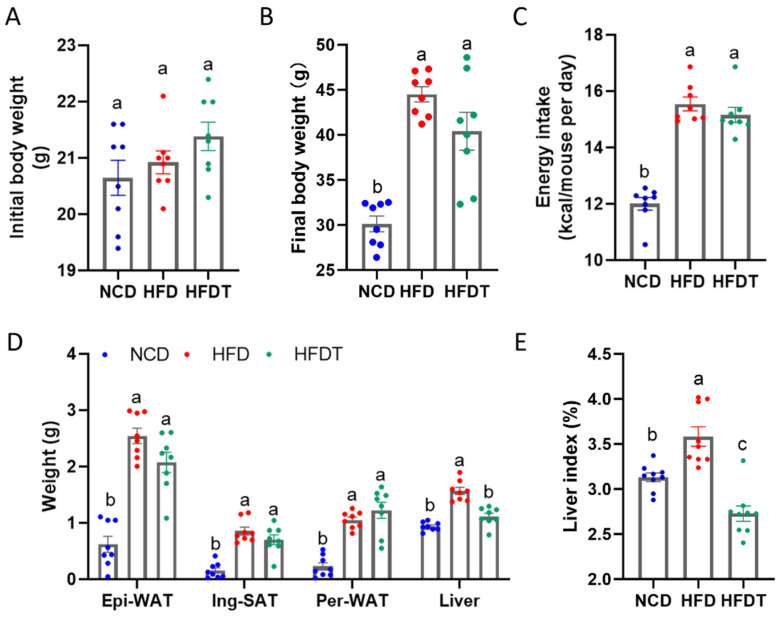
Figure 2.
Effect of TP on body weight and liver index in HFD-fed mice. (A) Initial body weight; (B) Final body weight; (C) Energy intake; (D) Epi-WAT, Ing-SAT, Per-WAT and liver weight (E) Liver index. Values are expressed as the mean ± SEM. Graph bars in (A–E) marked with different letters represent statistically significant results (p < 0.05). (Abbreviated: Epi-WAT: Epididymal white adipose tissue; Ing-SAT: Inguinal subcutaneous adipose tissue; Per-WAT: Perirenal white adipose tissue).

