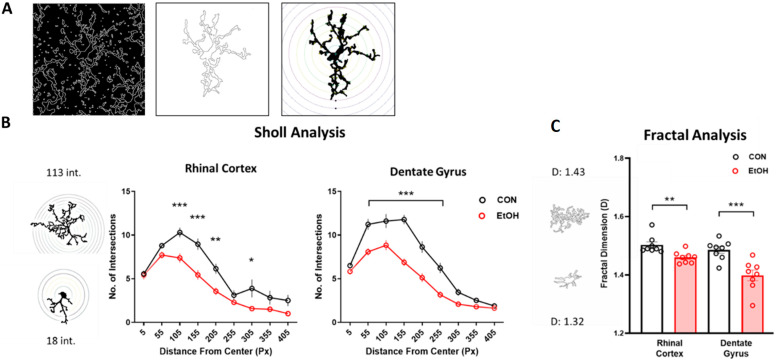
Figure 4.
Alcohol blunts the complexity of microglia branching (morphology). Representative images (T7; 40X; Iba1+) showing microglia reconstruction (A). The image was thresholded and the find edges function in ImageJ was used to create an outline of all microglia. A cell was selected, and broken processes joined by hand to create both outlined and filled cells. Sholl analysis to quantify microglia branching complexity in control (black) and ethanol (red) diet-treated rats (B, ImageJ plugin). Representative images of greatest and least number of intersections (“int”). Results of complexity analysis in control (black) and ethanol (red) diet-treated rats (C; Fraclac for Fiji). Representative images of greatest and least complexity (“D”). Cells were pooled for each subject. Sholl: two-way ANOVA with Bonferroni-corrected comparisons; fractal analysis: t-test in each region. *** p < 0.001, ** p < 0.01, * p < 0.05.

