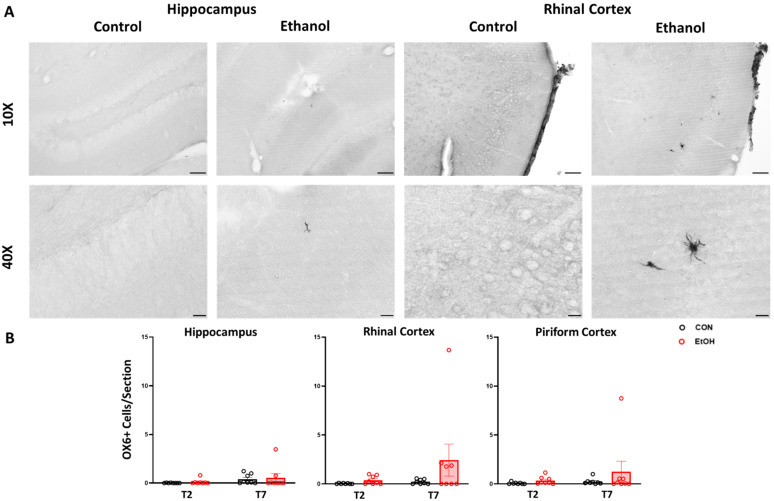
Figure 5.
Representative OX-6/MHCII images in the rhinal cortex of control and ethanol diet-treated rats at T2 (A). OX-6 cell count data for the hippocampus, rhinal cortex, and piriform cortex in control (black) and ethanol (red) treated-rats (B). No significant differences were found via two-way ANOVA. Scale bars: top row 100 µm, bottom row 20 µm.

