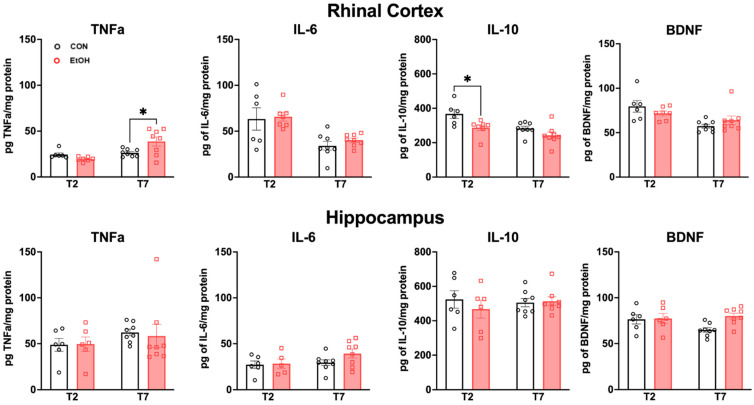
Figure 7.
ELISA assays for proinflammatory neuroimmune markers TNFα and IL-6, and anti-inflammatory markers IL-10 and BDNF in control (black) and ethanol (red)-treated rats. In the rhinal cortex there was more TNFα in the ethanol group compared to controls at T7 (p = 0.0105). There was also significantly less IL-10 detected in the ethanol group compared to the controls at T2 (p = 0.0176). Two-way ANOVA with Bonferroni post-hoc comparisons. * p < 0.05.

