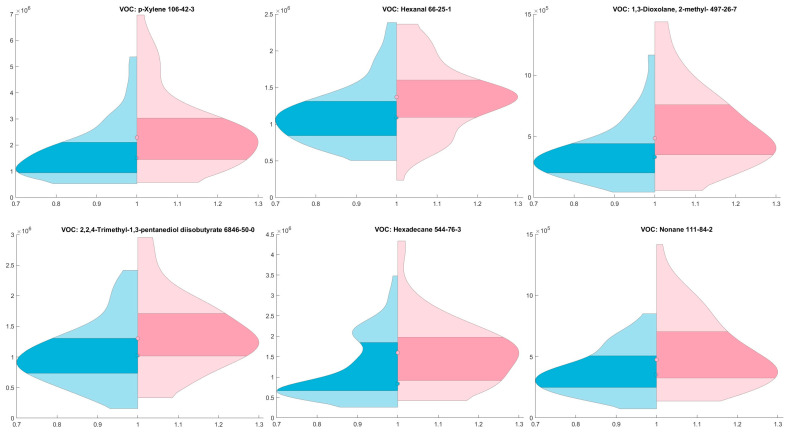
Figure 1.
Comparison of Chemical Spike Areas Between Control and Cancer Groups: Violin Plot Analysis; blue represents the control group, while red represents the cancer group; Y-axis denotes the area values, with dots indicating the median for each group and the darker area indicates 25th to 75th percentile. Figure shows the most common VOCs in groups.

