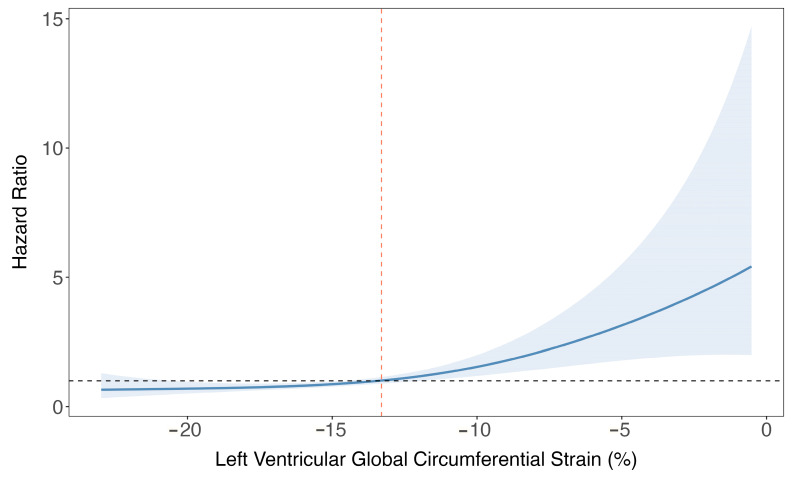
Figure 3.
Spline curve showing the hazard ratio for the occurrence of ventricular arrhythmic (VA) events at follow-up according to left ventricular global circumferential strain (LV GCS). This curve (blue line) shows the association of hazard ratio for the incidence of VA events along with 95% confidence intervals (blue bands) across a range of values of LV GCS at the time of the cardiac MR. The value of LV GCS in which the predicted HR is ≥1 can be used as a cut-off to stratify the population in high- and low-risk (dashed orange line).

