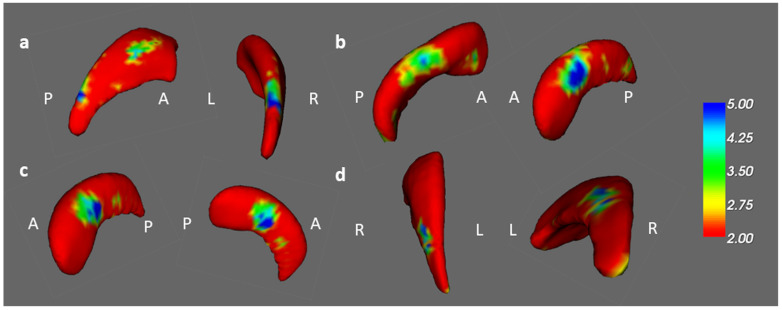
Figure 8.
The shape result in the longitudinal study. There were significant shape changes in the (a) left caudate and (b) left hippocampus between the prechemotherapy patients and healthy controls from TP1 to TP2. (corrected p value < 0.05, color bar: F scores) In the paired t test, we observed shape alterations in the (c) left hippocampus between the BB and BBF groups and in the (d) right caudate between the BH and BHF groups. (corrected p value < 0.05, color bar: F scores, A: anterior, P: posterior).

