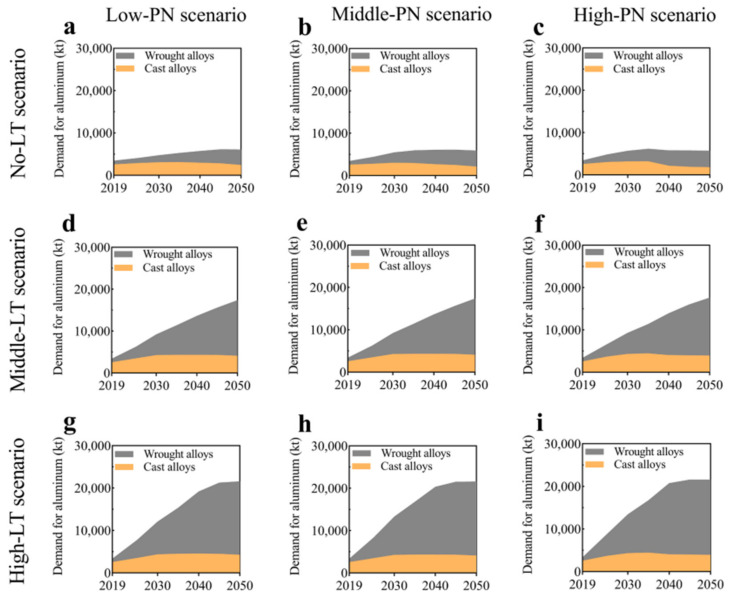
Figure 7.
Aluminium alloy-specific Chinese automotive demand estimates. Top to bottom, the three rows show No-LT (a–c), Middle-LT (d–f), and High-LT (g–i). Three columns show Low-PN, Middle-PN, and High-PN situations from left to right. Where LT = light-weighting-trend and PN = penetration scenario (reproduced with permission from Reference [218]; copyright © 2024 The Author(s). Published by Elsevier B.V.).

