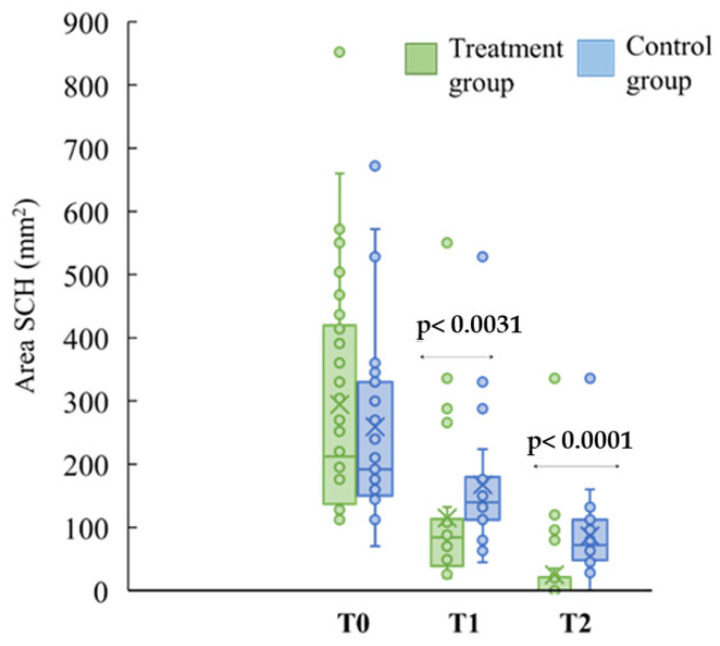
Figure 3.
Area (mm2) of hematoma resorption (SCH). The progress of subchorionic hematoma resorption was detected via ultrasound in the control group (n = 23; in light blue) and the treatment group (n = 30; in green) at different time points (T0, T1, T2). Mann–Whitney test was used to analyze variation in hematoma resorption between the group at T1 (p < 0.0031) and at T2 (p < 0.0001).

