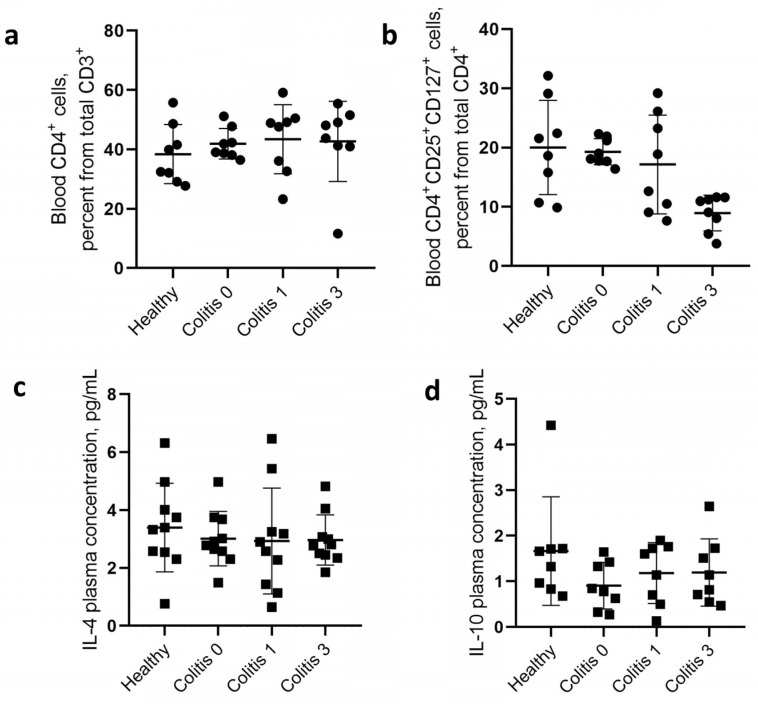
Figure 2.
Patient and healthy control group CD4+ cells and cytokine levels. Plots description: (a) Overall CD4+ T-cell content among all CD3+ cells. (b) presence of T-helper cells with activation phenotype CD25+CD127+; (c) IL-4 plasma concentration plot; (d) IL-10 plasma concentration plot. Designations: Healthy—healthy control volunteers; Colitis 0—Blood samples from patients before the SFMT; Colitis 1 and Colitis 3—Blood samples from patients after 1 and 3 months post SFMT, respectively.

