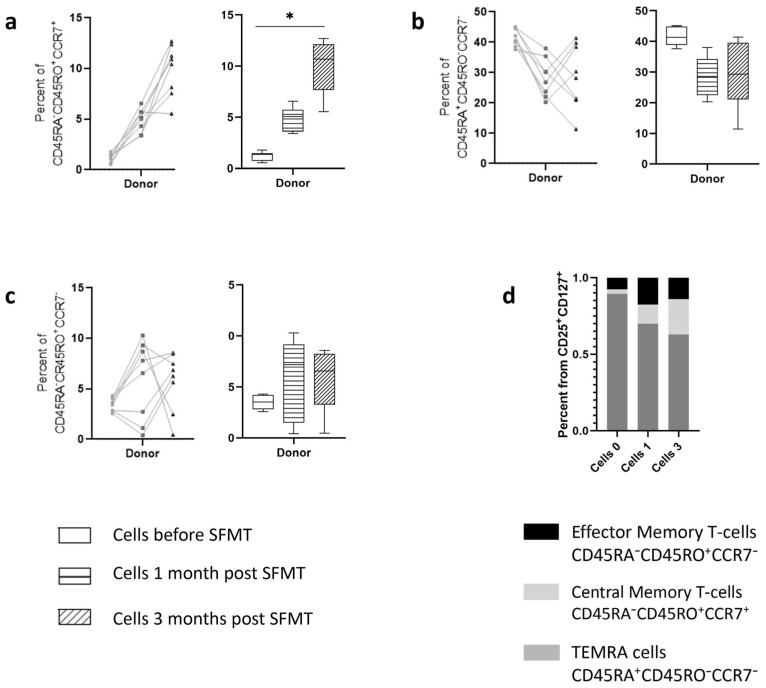
Figure 4.
Memory phenotypes of CD25+CD127+ T cells in ex vivo cultured conditions under stimulation with donor-derived stool filtrate. Each metric is shown in both pairwise (dotted lines) and median-wise plots to illustrate the intra-individual dynamics of the parameter as well as the global dynamics over the study group. Plots description: (a) percent of activated T cells with phenotype of Central Memory cells (CD45RA−CD45RO+CCR7+); (b) Percent of cells with phenotype of TEMRA-Cells’ + 5; (c) Subset of cells with phenotype of Effector Memory cells. (d) Relative content of memory cell phenotypes in culture medium. Effector memory cells percent of *—designate significance level p < 0.01.

