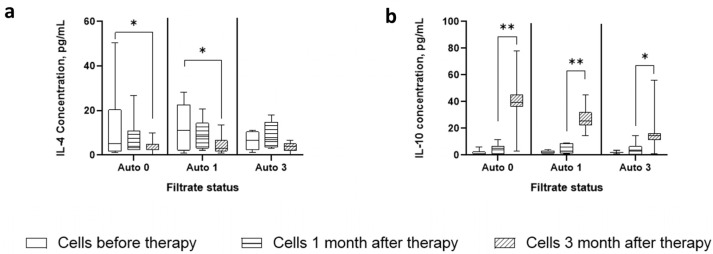
Figure 5.
Dynamics of cytokine production in cells of different time points stimulated with autologous filtrates of different time points. (a) IL-4 concentration plots; (b) IL-10 concentration plots. * designates p-value < 0.01, ** p-value < 0.001. Auto 0, Auto 1, and Auto 3 stand for Autologous stool samples taken right before therapy, 1 month after therapy, and 3 months after therapy.

