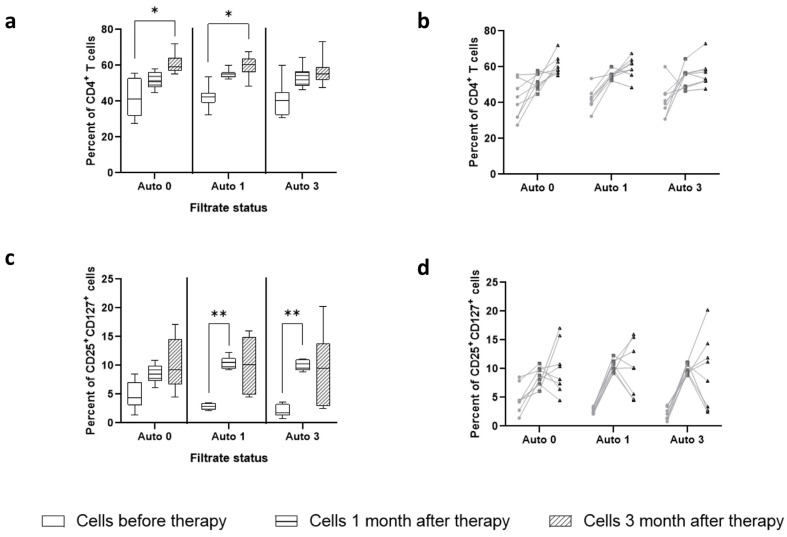
Figure 6.
Dynamics of patient’s cells stimulated with autologous filtrates of different time points. Each metric is shown in both pairwise (dotted lines) and median-wise plots to illustrate the intra-individual dynamics of the parameter as well as the global dynamics over the study group. (a) Content of CD4+ T-cells in cell culture population depends on time the cells were obtained or the sterile stool filtrate applied to the cell culture. (b) The same data presented pairwise to demonstrate patient-specific dynamics. (c) Activation of CD4 T-cells based on CD25 and CD127 surface expression profiles. (d) The same data presented pairwise to demonstrate patient-specific dynamics. ** indicates significance level p < 0.001, * indicates significance level p < 0.01.

