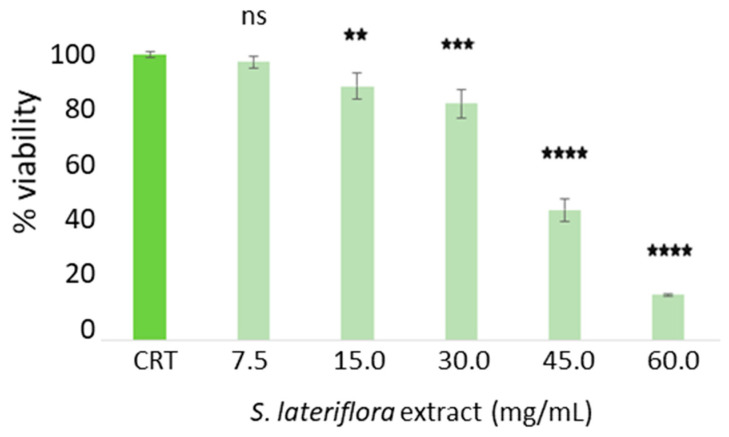
Figure 6.
H295R Cell viability after treatment with S. lateriflora extract in the concentration range of 60–7.5 mg/mL. CTR: cells not treated with S. lateriflora extract. Data were expressed as mean ± SD from three biological replicates. ** p < 0.01, *** p < 0.001, **** p < 0.0001, and ns: not significant.

