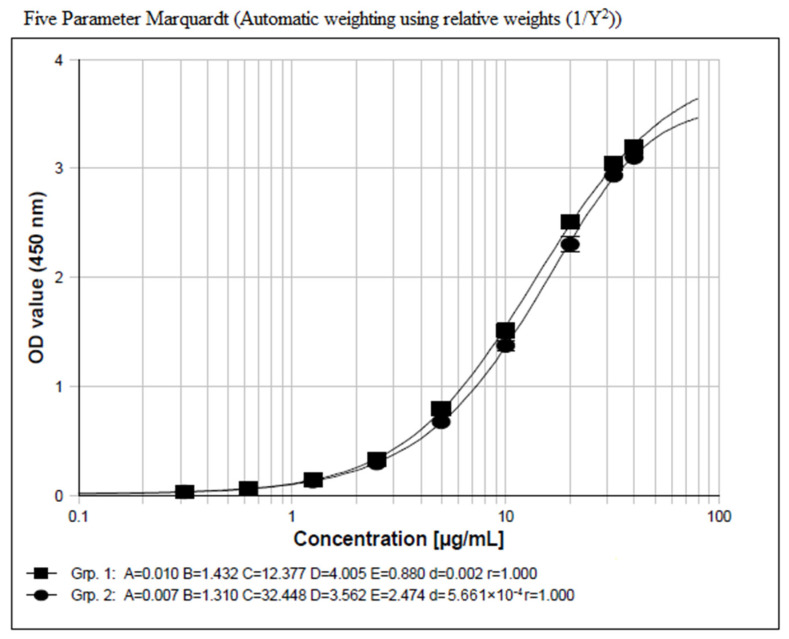
Figure 1.
Concentration–signal response relationship of an ADC with a DAR value of 8 (solid rectangle line) versus that of an ADC with a DAR value of 4 (solid oval line). The x-axis represents nominal concentrations of calibration standards and the y-axis represents optical density (OD) values at 450 nm after subtraction of a matrix blank signal. A logistic model (5-parameter weight 1/Y2) is used for curve fitting with the following equation: Resp. = (A − D)/((1 + (Conc./C) B) E) + D. Among the parameters, A, B, C, D, and E are values for different coefficients, d stands for average square deviation of coefficient values, and r stands for the absolute value of the correlation coefficient.

