Figure 4.
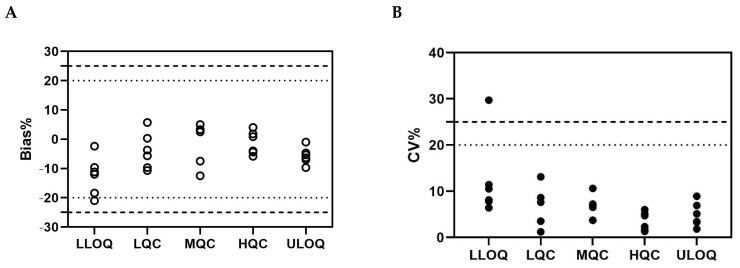
Intra-assay accuracy and precision of the ADC assay. The % bias and % CV of different QC samples from six independent intra-assay accuracy and precision runs are presented, respectively. The dotted lines and dashed lines shown in (A) represent a ±20% range for the LQC, MQC, and HQC, and a ±25% range for the LLOQ and ULOQ, respectively. The dotted line and dashed lines shown in (B) represent the 20% CV limit for the LQC, MQC, and HQC, and the 25% CV limit for the LLOQ and ULOQ, respectively. Hollow and filled circles represent Bias % and CV %, respectively.

