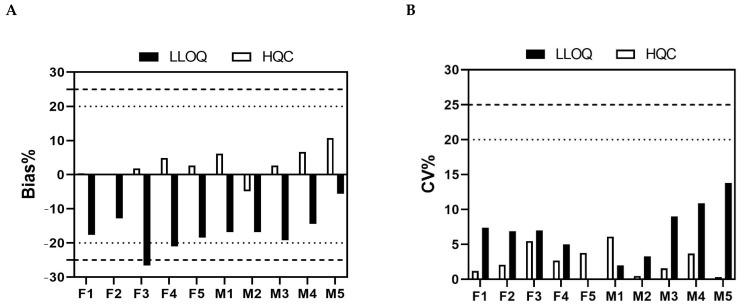
Figure 5.
Selectivity evaluation. Ten lots of naive plasma samples (five females and five males) were used for selectivity evaluation at HQC and LLOQ levels. F1 to F5 stand for female 1 to female 5 plasma samples, and M1 to M5 stand for male 1 to male 5 plasma samples. The results indicated that 9/10 of individual test samples met the acceptance criteria, except that the bias % of female 3 (F3) at the LLOQ level was slightly beyond −25.0%. The dotted lines and dashed lines shown in (A) represent ±20% and ±25% ranges for the HQC and LLOQ, respectively. The dotted line and dashed lines shown in (B) represent 20% and 25% CV limits for the HQC and LLOQ, respectively.

