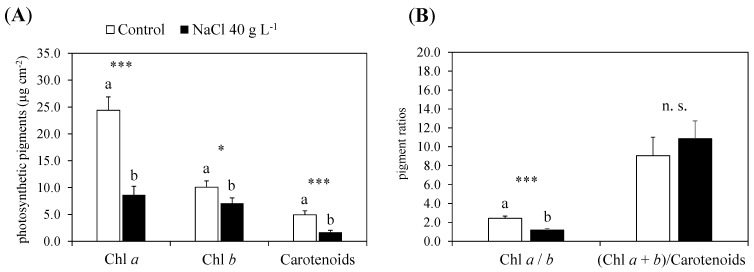
Figure 6.
Leaf concentration of chlorophylls and carotenoids (A) and pigment ratios (B) in the control (0 g L−1 NaCl) and treated (40 g L−1 NaCl) plants of guayule after 30 days of growth under increasing NaCl concentrations. Values are means ± standard error (SE) of six biological replicates or plants (n = 6). Statistics as in Figure 5.; n.s., not significant; * and ***, significantly different at p ≤ 0.05 and p ≤ 0.001, respectively. Abbreviations: Chl a, chlorophyll a; Chl b, chlorophyll b; Chl a + b, total chlorophyll.

