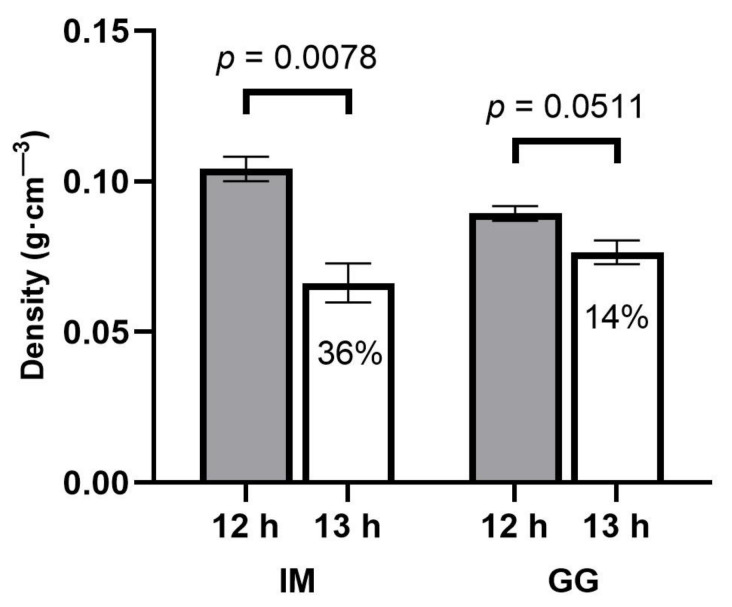
Figure 6.
Apical inflorescence density responses to 12 h (filled bars) and 13 h (empty bars) photoperiod treatments of C. sativa cultivars ‘Incredible Milk’ (IM) and ‘Gorilla Glue’ (GG). Data are means ± SE, n = 3. Error bars are presented for all data but may be obscured for small SE values. Percentage values marked in the 13 h bars signify the decrease in apical inflorescence density relative to the 12 h treatment, and the p-values above each cultivar represent the significance level of the comparison of means according to Student’s t-test.

