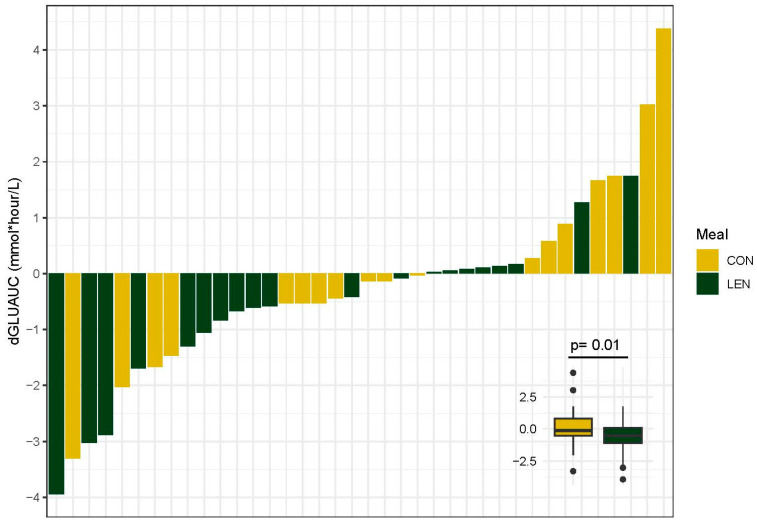
Figure 3.
Summary plots of individual changes (post-intervention–pre-intervention) in glucose area under the curve (dGLUAUC). dGLUAUC values represent the change in the sum of values from fasting and hourly timepoints for 5 h post high-fat meal ingestion. Each bar is representative of the value for one participant (n = 38). Difference in dGLUAUC between meal groups determined with ANOVA and displayed in inset. CON, control and LEN, lentil.

