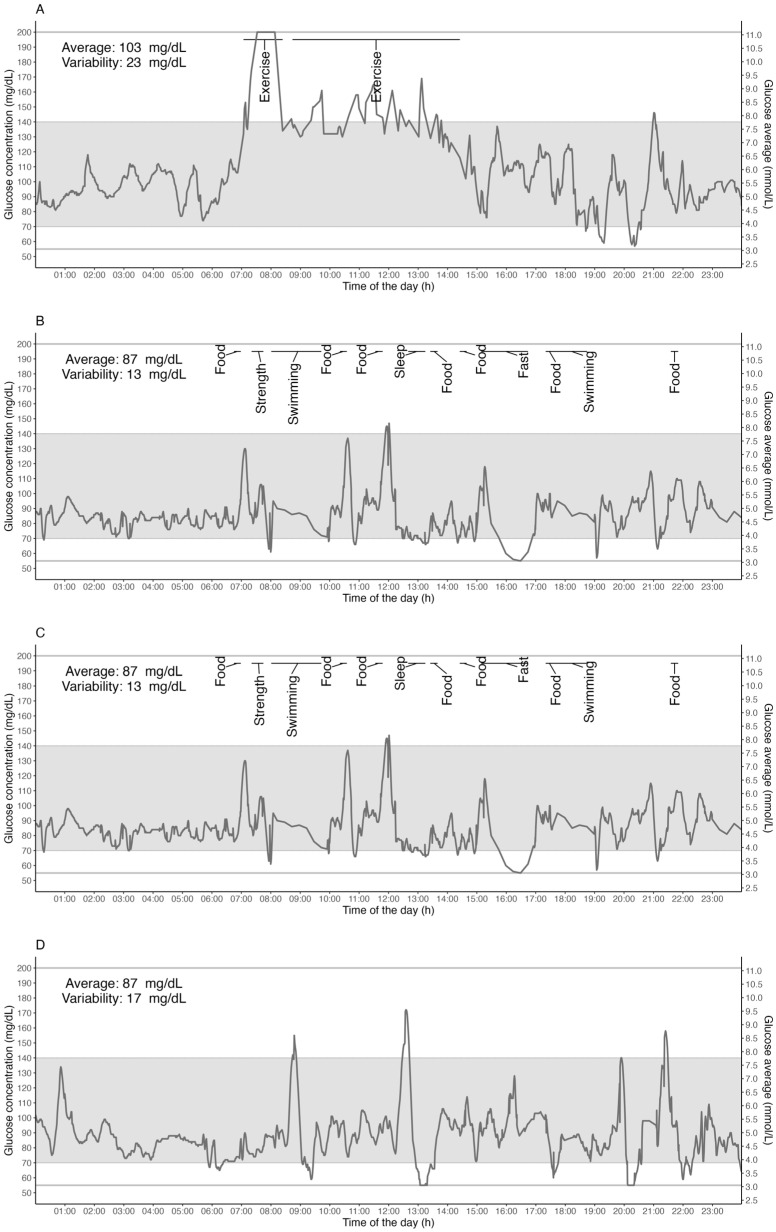
Figure 5.
Individual traces give detailed insight into possible individual variations. Examples of days for representative users were chosen from the database, and they delineate 24 h glucose response on a long-race day ((A) a well-trained long-distance trail female runner in a race); a double-training day ((B) an elite male swimmer); a single-training day ((C) an elite female swimmer); and a rest day ((D) well-trained long-distance male trail runner). Gray horizontal lines represent the limits of the lowest and highest measurable glucose concentrations (i.e., 55 mg/dL and 200 mg/dL). The gray band area represents the 70–140 mg/dL range of concentration.

