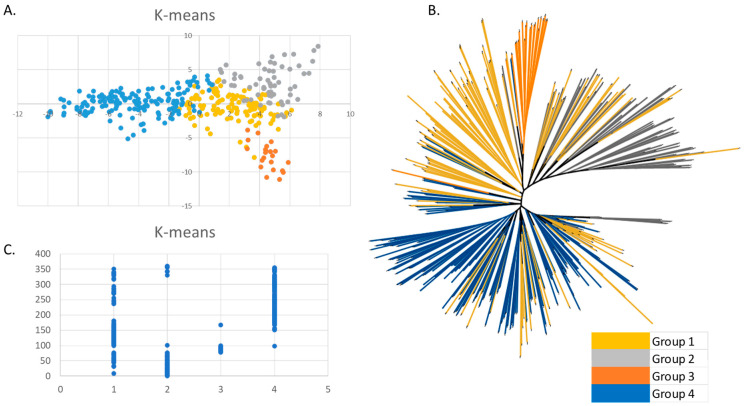
Figure 5.
Clustering and phylogenetic analysis of the maize panel: (A) population structure generated with K-means combined with PCA; (B) phylogenetic tree: colors indicate the groups identified through K-means, in black common sections of branches are reported; (C) correspondence between the grouping obtained through K-means and the phylogenetic tree.

