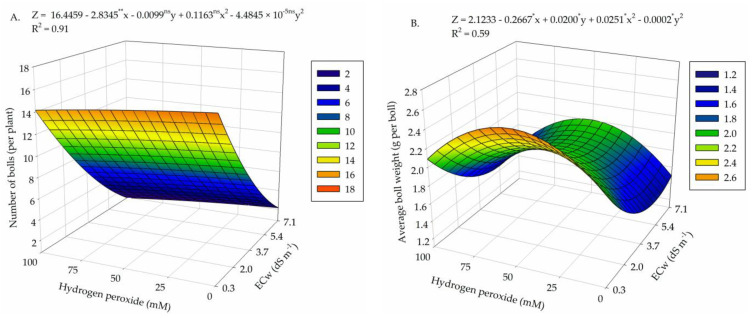
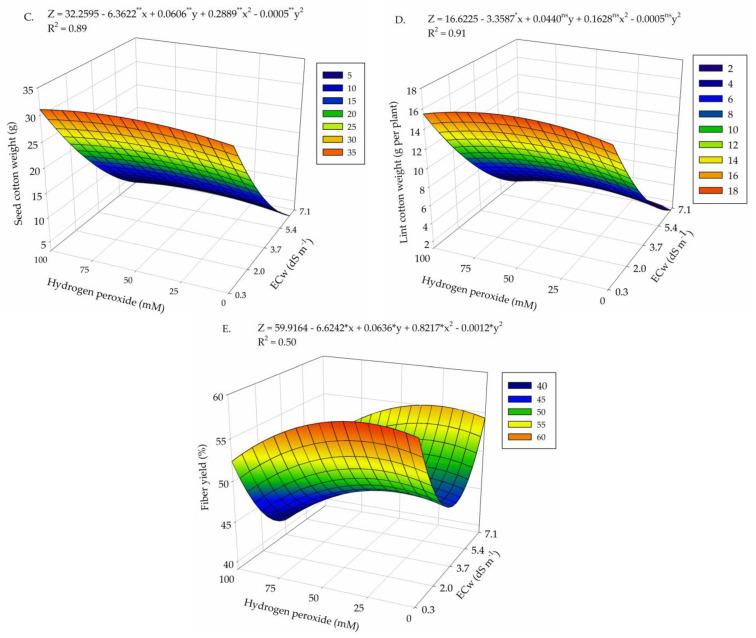
Figure 4.
Number of bolls (A), average boll weight (B), seed cotton weight (C), lint cotton weight (D), and fiber yield (E) of cotton as a function of the interaction between irrigation water salinity levels (ECw) and hydrogen peroxide (H2O2) concentrations at 130 days after sowing. X and Y—electrical conductivity of water—ECw, and concentration of hydrogen peroxide—H2O2, respectively. ns, *, **—not significant, significant at p ≤ 0.05, and significant at p ≤ 0.01 by F-test, respectively.


