
Fig 7. Comparison of box plots for the growth exponents β calculated for virtual BMs performed with the DSBMS.
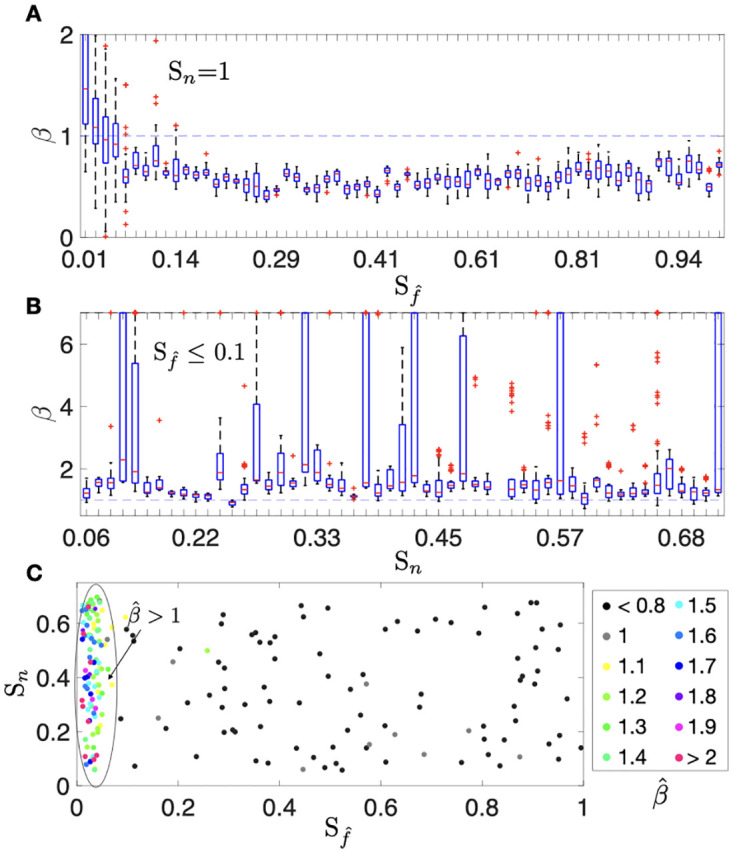
A. Growth exponents β values computed for the group of 200 simulations with Sn = 1 and . B. Growth exponents β values computed for the group of 200 simulations with 0.1 ≤ Sn ≤ 0.7 and . C. Scatter plot that shows the β median calculated for the virtual BMs which were simulated with different values of (, Sn). Basal rate parameters for the simulations are shown in Table 3.