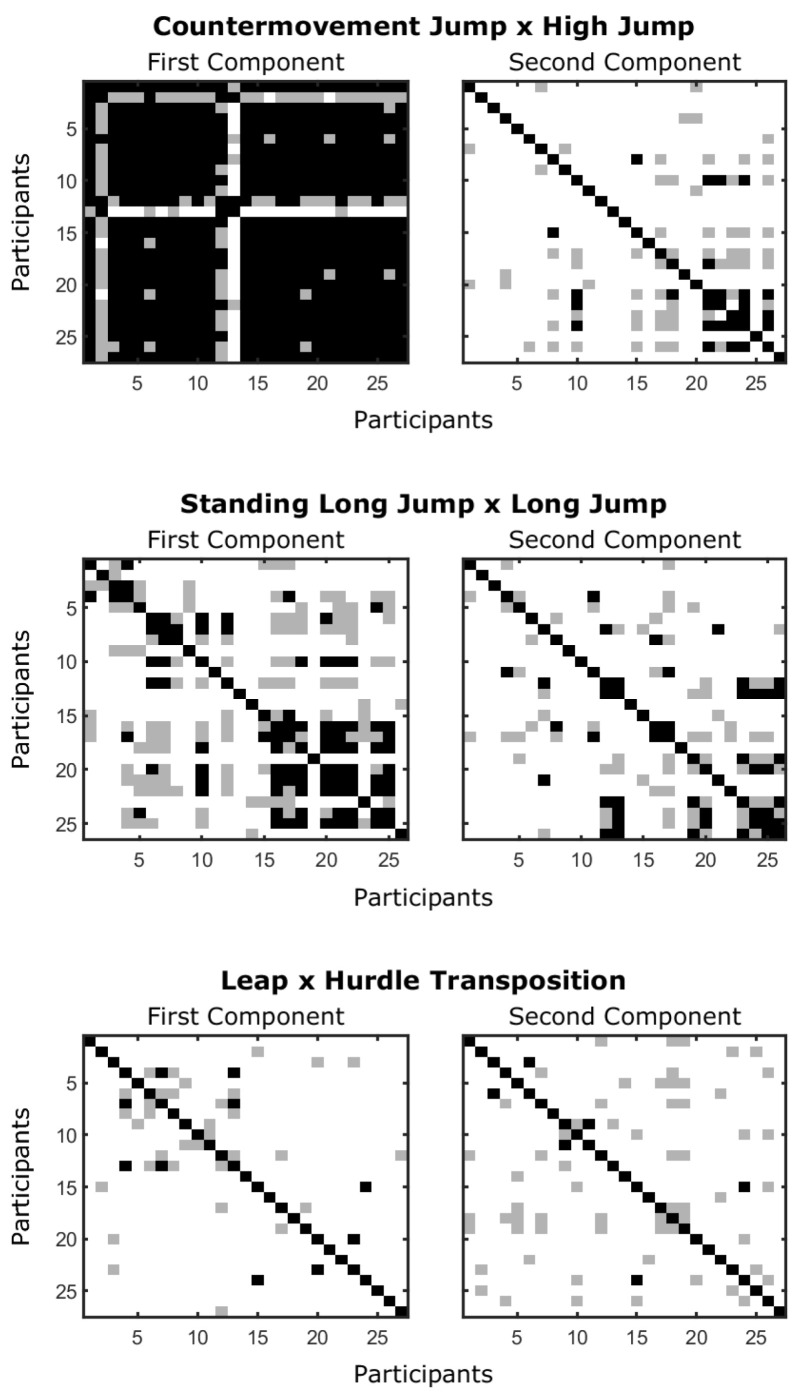
Figure 3.
Similarity among individuals (normalized dot product) in their fundamental movement pattern (first and second principal components). Black squares mean normalized dot products higher than 0.9 and gray squares mean normalized dot products higher than 0.8. Individuals are sorted by their performance of the sport skill with higher values (lower right corner) meaning better performances of the sport skill.

