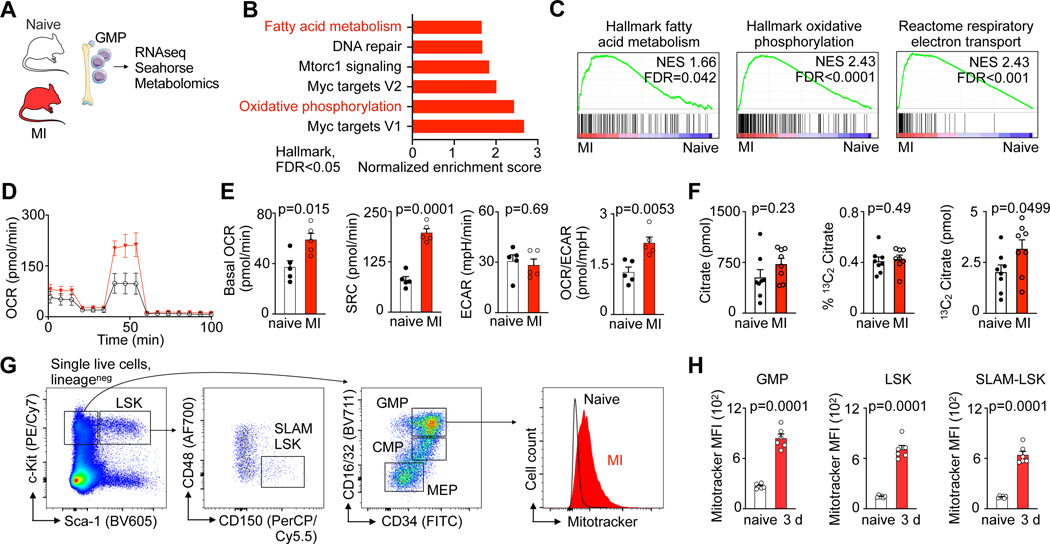
Fig. 1 |. Myocardial infarction enhances fatty acid metabolism in hematopoietic stem and progenitor cells.
A, Experimental design. B, Hallmark gene sets significantly (FDR<0.05) enriched in granulocyte monocyte progenitors (GMP) from mice with myocardial infarction (MI). GMP were isolated from the bone marrow of control mice and day 2 after MI (n=3 control, n=3 MI). C, Gene set enrichment analysis showing upregulation of “Hallmark oxidative phosphorylation”, “Hallmark fatty acid metabolism” and “C2 Reactome respiratory electron transport” in GMP isolated from mice with MI. D, Real-time changes in the oxygen consumption rate (OCR) of GMP sorted from control mice compared to day 3 after MI (n=5 control, n=5 MI, two independent experiments), assessed by Seahorse assay. E, Quantification of basal OCR, spare respiration capacity (SRC), extracellular acidification rate (ECAR) and OCR/ECAR ratio of GMP sorted from control mice versus day 3 after MI (n=5 control, n=5 MI, two-tailed Welch’s t test, two independent experiments). F, Abundance of citrate, percentage of 13C2 labelled citrate, and amount of total 13C2 citrate as measured by mass spectrometry in 300,000 GMP isolated from control and day 3 post-MI mice that were injected with 13C16 palmitate (n=8 mice per group, two-tailed Mann-Whitney test, two independent experiments). G, Flow cytometry gating for hematopoietic stem and progenitor cells (HSPC) in mice and histogram of MitoTracker™ Green FM intensity in GMP from controls and mice on day 3 after MI. H, Mean fluorescence intensity (MFI) of MitoTracker™ Green staining in control mice versus day 3 after MI (n=5 control, n=6 MI, two-tailed Welch’s t test). Data are displayed as mean±SEM.

