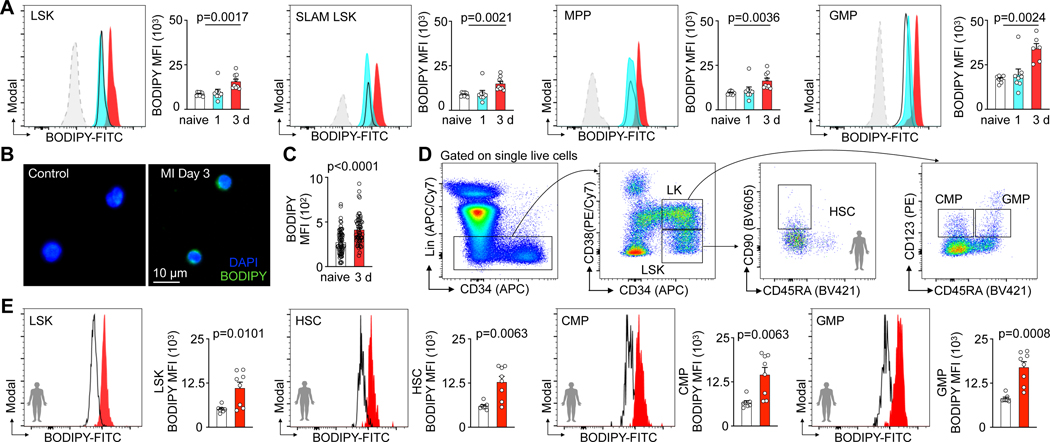
Fig. 2 |. Hematopoietic stem and progenitor cells display increased fatty acid content in response to myocardial infarction.
A, Histograms and quantification of BODIPY lipid dye fluorescence intensity in LSK, SLAM-LSK, MPP and GMP from controls and mice day 1–3 after MI (n=9 control, n=8 MI day 1, n=9 MI day 3 for LSK, SLAM LSK and MPP, n=7 control, n=8 MI day1, n=6 MI day3 for GMP, one-way ANOVA followed by Dunnett’s post-test, four independent experiments). B, Fluorescence microscopy image of lipid BODIPY staining in GMP sorted from control mice versus day 3 after MI. C, Quantification of BODIPY mean fluorescence intensity (MFI) in sorted GMP from control mice versus day 3 after MI (n=12 control, n=10 MI, 6 measurements from each mouse, two-tailed Welch’s t test, three independent experiments). D, Flow cytometry gating for human bone marrow HSPC. E, Quantification of BODIPY lipid dye fluorescence intensity in LSK, HSC, CMP and GMP in controls versus patients on days 3–6 after MI (n=7 controls, n=8 MI patients, two-tailed Welch’s t test, three independent experiments). Data are displayed as mean±SEM.

