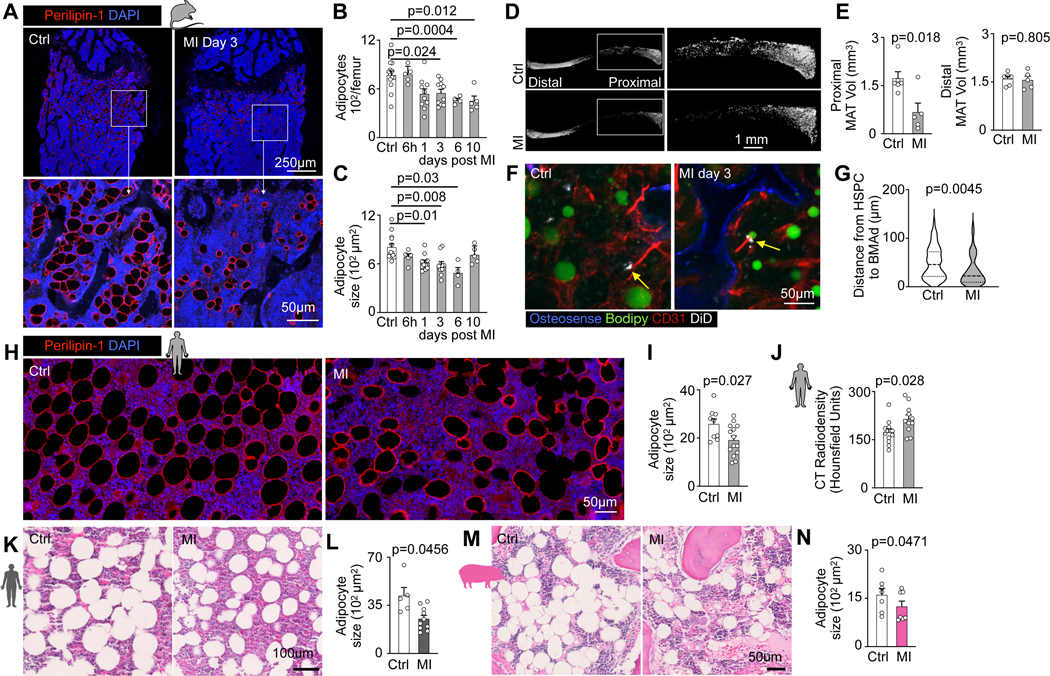
Fig. 4 |. Myocardial infarction reduces bone marrow adiposity.

A, Bone marrow adipocyte immunofluorescence staining for Perilipin-1 in controls versus mice on day 3 after MI. B, Quantification of adipocyte numbers and C, adipocyte size in femurs on indicated days after MI (n=13 control, n=4–10 per time, Brown-Forsythe and Welsh Anova with Dunnett’s T3 multiple comparison, six independent experiments). D, Representative Osmium μCT images and E, quantification of marrow adipose tissue (n=6 control mice, n=5 MI day 3, two-tailed Welch’s t test, 2 independent experiments). F, Confocal imaging of DiD-labeled LSK, adipocytes and endothelial cells in controls versus 3 days after MI. G, Quantification of LSK distance to the next adipocyte in control mice versus day 3 after MI (n=6 control, n=7 MI, two-tailed Welch’s t test, three independent experiments). H, Vertebral bone marrow adipocyte immunofluorescence staining for Perilipin-1 in humans with or without MI. I, Quantification of adipocyte size (n=9 controls, n=14 MI patients, two-tailed Welch’s t test). J, Vertebral density measurement by CT in control subjects without MI and patients admitted with acute MI (n=11 controls, n=11 MI, two-tailed Welch’s t test). K, Histology staining of sternal bone marrow samples from patients with myocardial infarction vs control patients. L, Quantification of adipocyte size (n=5 control subjects, n=10 MI patients, two-tailed Welch’s t test). M, Histology staining of bone marrow biopsies from the iliac crest of pigs before versus post-MI. N, Quantification of adipocyte size (n=7, two-tailed paired t test). Data are displayed as mean±SEM.
