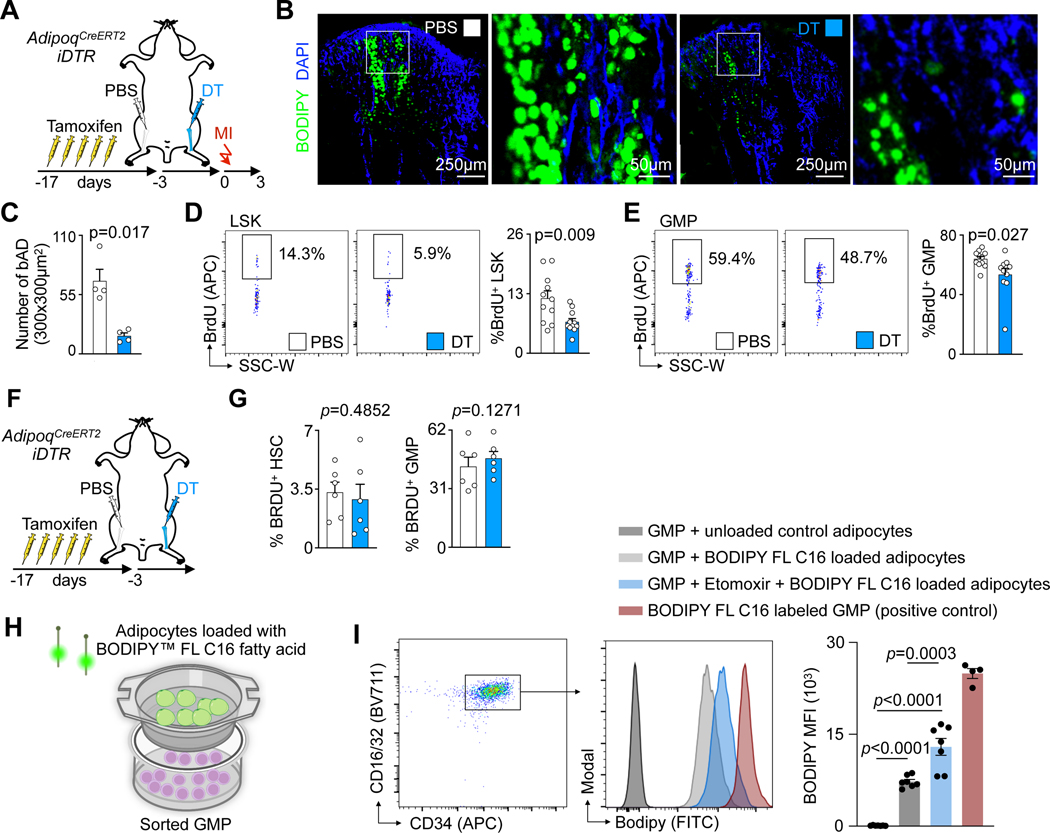
Fig. 6 |. Local depletion of bone marrow adipocytes leads to reduced emergency hematopoiesis.
A, Experimental design for single leg adipocyte depletion before MI. B, Immunofluorescence imaging of adipocytes in PBS- versus diphtheria toxin- (DT) injected tibias. C, Number of adipocytes in PBS- versus DT-injected tibias (n=4 mice, two-tailed paired t test, three independent experiments). D,E, Flow plots and proliferation quantification of LSK (D) and GMP (E) in PBS- versus DT-injected tibias 3 days after MI (n=11, two-tailed paired t test, three independent experiments). F, Experimental design for single leg adipocyte depletion. G, Proliferation quantification of HSC and GMP in non-MI mice (n=6, paired t test). H, Experimental design for in vitro FFA transfer experiment. I, Gating strategy, histogram, and quantification of BODIPY FL C16 in GMPs co-cultured with adipocytes (GMPs and adipocytes from n=4 mice for the positive control, n=7 for every other group, One-way ANOVA with Tukey’s multiple comparison tests, two independent experiments). Data are displayed as mean±SEM.

