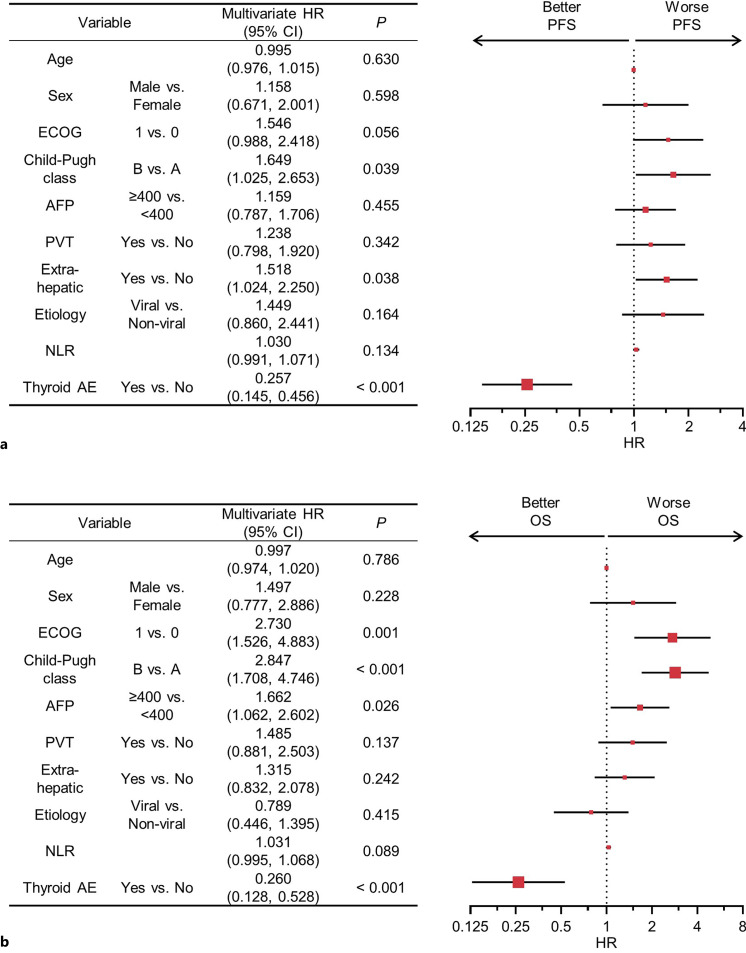
Fig. 2.
Multivariable analysis of PFS and OS. Forest plots showing multivariate HRs and 95% CIs for PFS (a) and OS (b). HR, hazard ratio; CI, confidence interval; ECOG, Eastern Cooperative Oncology Group performance status; AFP, alpha-fetoprotein; MVI, macrovascular invasion; NLR, neutrophil-lymphocyte ratio; AE, adverse event; PFS, progression-free survival; OS, overall survival.

