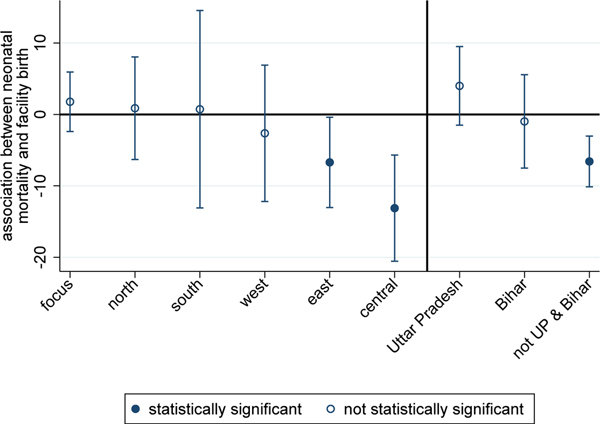
Figure 3: Associations between NNM and facility birth, with controls, 2015–2016.
Note: The figure plots OLS regression coefficients and confidence intervals (computed with standard errors clustered by PSU) from regressions of NNM on facility birth and controls (see Equation 2 and Section 2.2 for a description of the controls) for regions and states of India. The note for Figure 2 lists the states that correspond to each region.

