
Figure 5.
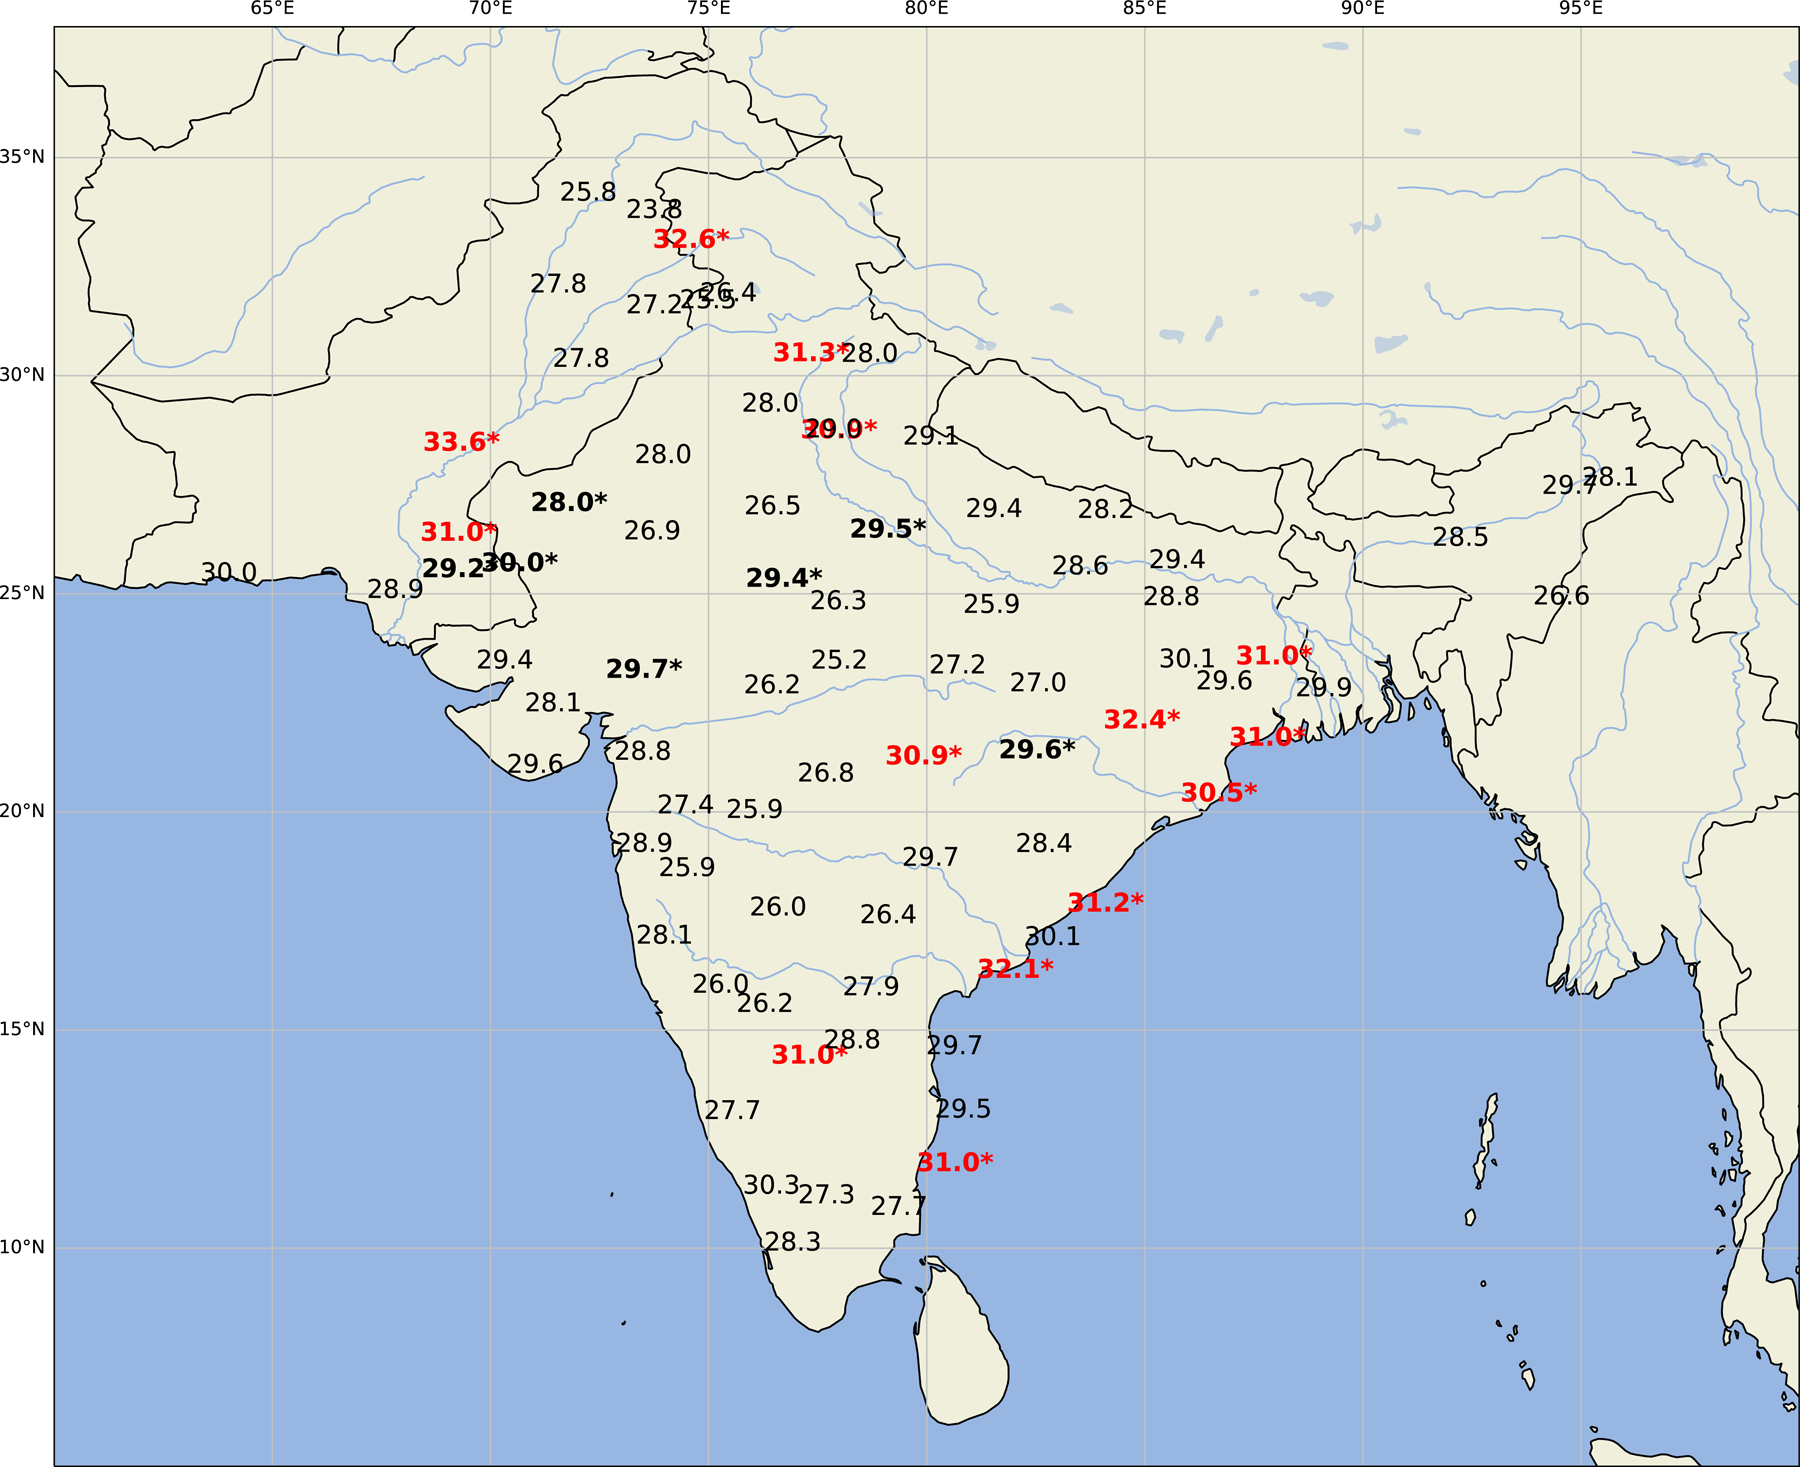
Maximum recorded surface wet-bulb temperatures for the period March 1 – June 1, 2022 in India and Pakistan. Bolded values signify wet-bulb temperatures over the compensability thresholds found in the PSU HEAT Project. Red values are those over 30.5°C, the moist heat stress critical value, while black values with asterisks represent values associated with threshold exceedance in the drier parts of the Tdb – RH distribution. Data from the Hadley Centre’s Integrated Surface Dataset (HadISD).