Figure 5.
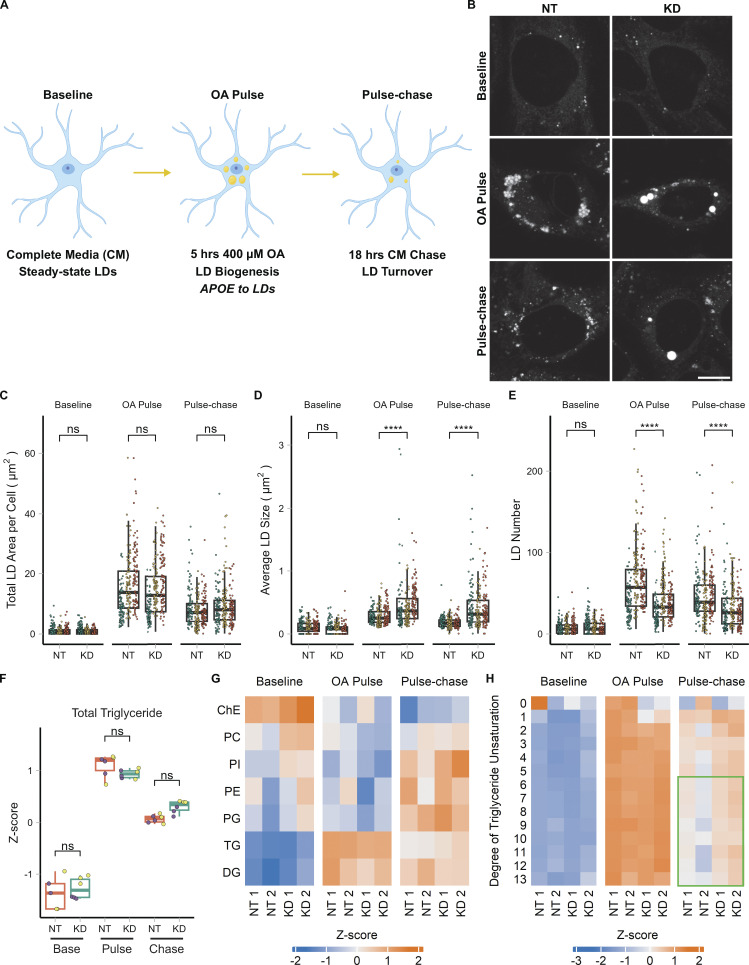
APOE modulates LD size distribution and triglyceride saturation. (A) Cartoon outlining the OA pulse-chase assay used in this figure, as well as Fig. 7. TRAE3-H cells are treated with 400 µM OA for 5 h to induce LD biogenesis. This is followed by a chase in unsupplemented complete media (CM) for 18 h, during which LDs are catabolized. Imaging and untargeted lipidomics were performed on cells at the baseline, OA pulse, and pulse-chase timepoints. (B) Representative TRAE3-H cells transfected with non-targeting (NT) or APOE (KD) siRNA, stained for LDs with BODIPY 493/503, and imaged live at each timepoint of the OA pulse-chase assay. Scale bar, 10 µm. (C–E) Quantification of LD parameters in NT or APOE KD cells at each timepoint of the OA pulse-chase assay. (C) Total LD area was measured as the area of the entire LD mask per cell in µm2. (D) Average LD size was calculated as the mean LD area per cell in µm2. (E) Number of LDs per cell. Each data point represents one cell, and each color represents data collected from a separate, independent experiment. N = 90 cells per genotype, timepoint, and independent experiment. ns P > 0.05, **** P < 0.0001. P values were calculated using a clustered Wilcox rank sum test via the Rosner–Glynn–Lee method and Bonferonni-corrected for multiple comparisons. (F) Comparison of total triglyceride between NT and APOE KD cells. Lipidomics data were collected from two independently performed experiments which each used three separate plates of cells as technical replicates. Each data point denotes a single technical replicate, and the dot colors indicate data collected from the same independently performed experiment. There is no significant difference in the abundance of triglyceride between NT and APOE KD at any timepoint. ns P > 0.05. P values were calculated using the Wilcox rank sum test and Bonferonni-corrected for multiple comparisons. (G) Heatmap showing the relative abundance of measured lipid classes at each timepoint of the assay. Heatmap values were derived from the means of three technical replicates from two independently performed experiments (shown as separate columns) for each condition. Means were then grouped by lipid class and Z-score normalized. ChE, cholesterol ester; PC, phosphatidyl choline; PI, phosphatidylinositol; PE, phosphatidyl ethanolamine; PG, phosphatidylglycerol; TG, triacylglycerol; DG, diacylglycerol. (H) Heatmap of the abundance of triglyceride species separated by their degree of unsaturation at each timepoint of the assay. Heatmap values were derived from the means of three technical replicates from two independently performed experiments (shown as separate columns) for each condition. Means were grouped by lipid class and Z-score normalized. The green box frames lipid species enriched in APOE KD.

