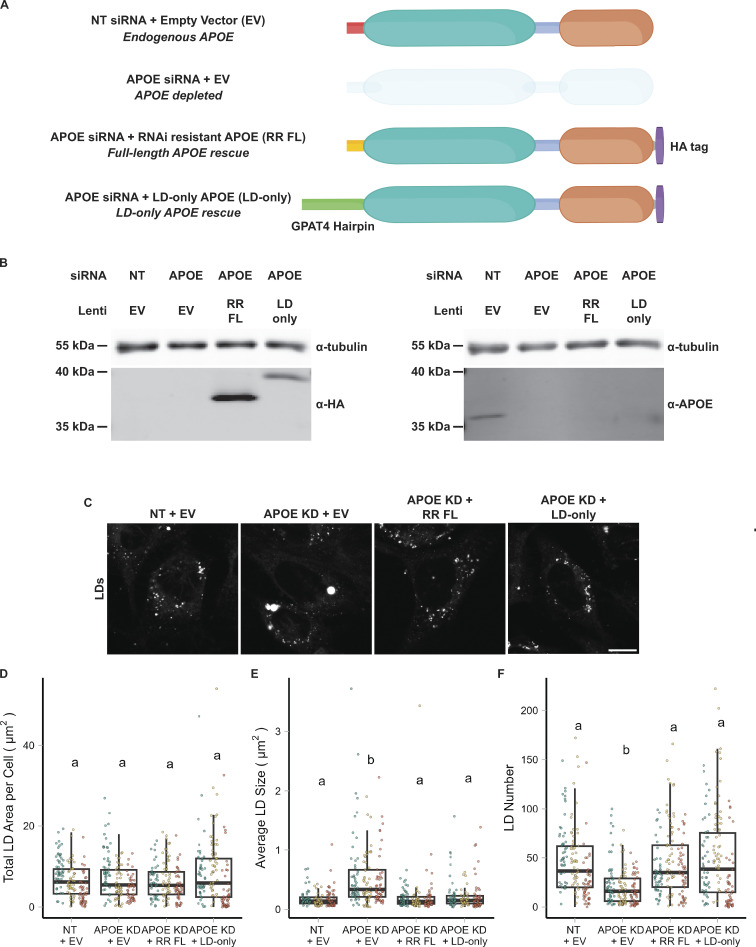
Figure 6.
LD-associated APOE modulates LD size. (A) Cartoon illustrating the conditions used in the APOE rescue experiment. Endogenous APOE3 protein is present in cells transfected with a non-targeting siRNA. APOE protein is depleted upon APOE knockdown. The siRNA used to knock down APOE targets the mRNA sequence encoding the N-terminal signal peptide. The RNAi-resistant full-length APOE (RR FL) rescue construct consists of APOE3 with synonymous mutations in the signal peptide that impart resistance to the APOE siRNA. The LD-only APOE construct has the signal sequence removed, making it insensitive to the APOE siRNA, and replaced with the hairpin domain of the LD protein GPAT4. This version of APOE only targets LDs and never enters the ER lumen. (B) Western blot of lysates of TRAE3-H cells transfected with the indicated siRNA and transduced with the indicated lentivirus. The same samples were run on two separate SDS-PAGE gels, with 10 µg of total protein loaded into each well. Gels were transferred and then blotted with anti-HA or an anti-APOE antibody together with an anti-tubulin antibody. Both the RR FL and LD-only APOE constructs were expressed in an endogenous APOE knockdown background. Moreover, the HA tag obstructs the epitope of the APOE antibody, allowing endogenous APOE and exogenous, HA-tagged APOE to be distinguished. (C) Representative confocal slices of cells transfected with non-targeting siRNA or APOE siRNA and transduced with an empty vector control, RR FL APOE, or LD-only APOE. Cells were subjected to an OA pulse-chase as described in Fig. 5A, fixed, and stained for LDs with BODIPY 493/503. Scale bar, 10 µm. (D–F) Quantification of LD parameters for the conditions described in A after an OA pulse-chase assay. (D) Total LD area was measured as the area of the entire LD mask per cell in µm2. (E) Average LD size was calculated as the mean LD area per cell in µm2. (F) Number of LDs per cell. Each data point represents one cell, and each color represents data collected from a separate, independent experiment. N = 60 cells per condition and independent experiment. ns P > 0.05, **** P < 0.0001. P values were calculated using a clustered Wilcox rank sum test via the Rosner–Glynn–Lee method and Bonferonni-corrected for multiple comparisons. Source data are available for this figure: SourceData F6.

