Figure 8.
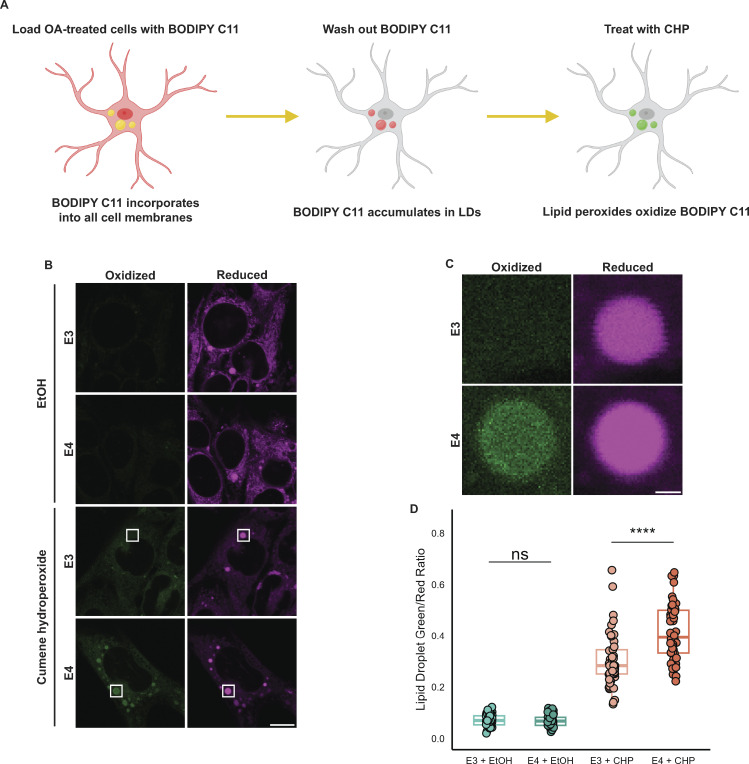
APOE4 LDs are more sensitive to lipid peroxidation. (A) Schematic of a BODIPY C11-based assay for measuring the lipid peroxidation sensitivity of LDs. Cells are first subjected to an OA pulse-chase as described in Fig. 5 A, washed with HBSS, and then loaded with 2 µM BODIPY C11 in HBSS for 30 min. After 30 min, BODIPY C11-containing HBSS is replaced with C11-free HBSS, and cells are incubated for 2 h, during which time BODIPY C11 incorporates into LDs. Cells are then treated with 0.2% ethanol vehicle (EtOH) or 200 µM cumene hydroperoxide (CHP) for 2 h and subsequently imaged. (B) Representative confocal slices showing TRAE3-H or TRAE4-H cells labeled with BODIPY C11 and treated with either 0.2% EtOH or 200 µM cumene hydroperoxide as described in A. The magenta channel shows reduced BODIPY C11 fluorescence, and the green channel shows the fluorescence of BODIPY C11 oxidized by lipid peroxides. Scale bar, 10 µm. (C) Inset of B shows the difference in peroxidation of LDs between E3 and E4 cells. Scale bar, 1 µm. (D) Quantification of peroxidation in LDs in E3 or E4 cells treated with EtOH or CHP. The ratio was calculated by dividing the mean fluorescence intensity of green (oxidized) BODIPY C11 fluorescence in the LD mask divided by the mean intensity of red (reduced) BODIPY C11 fluorescence. ns P > 0.05, **** P < 0.0001. N = 50 cells per condition. Each data point represents one cell. Data were collected and pooled from three independent experiments. P values were calculated via the Wilcoxon rank-sum test and Bonferonni-corrected for multiple comparisons.

