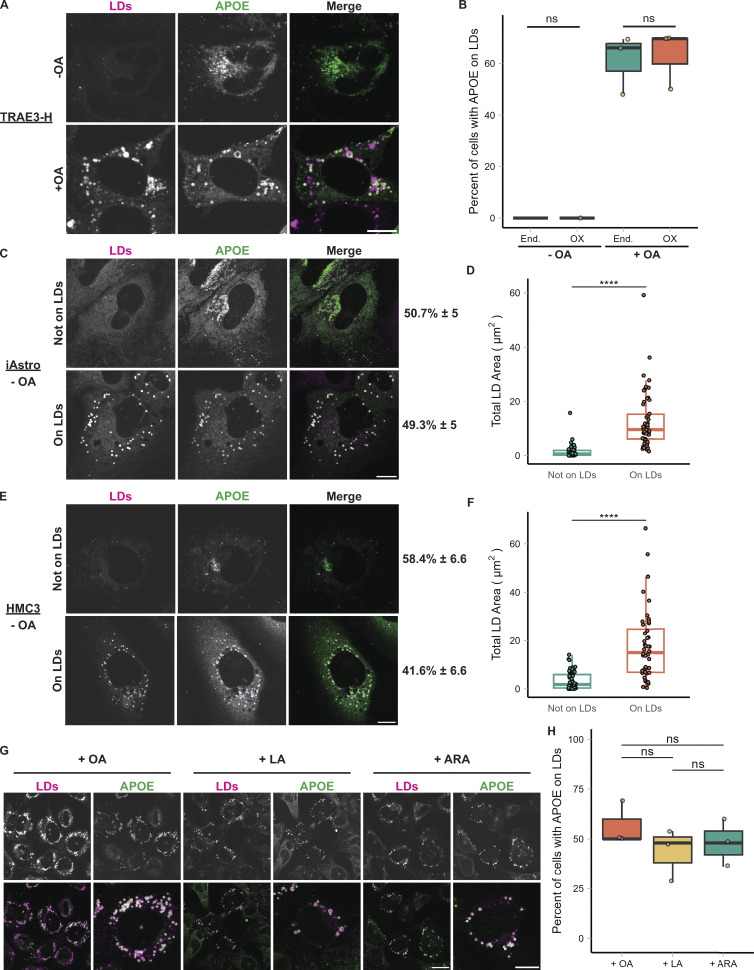
Figure S2.
Effect of APOE overexpression on LD targeting; targeting of APOE to LDs in iAstros and HMC3 cells and in response to multiple unsaturated fatty acids. (A) TRAE3-H cells transfected with APOE3-mEm, labeled for LDs with BODIPY 665/676, and treated ± OA. APOE3-mEm localizes to the secretory pathway in the absence of OA and shifts to LDs after OA treatment. Scale bar, 10 µm. (B) Percentage of cells that have either endogenous APOE or APOE3-mEm on the surface of LDs ± OA. Each data point represents the percentage of 35–50 randomly selected cells from one independent experiment with APOE on the surface of LDs. Data for endogenous APOE fractions are the same as in Fig. 1 E. There is no significant difference between endogenous and overexpressed APOE in the fraction of cells with APOE on LDs. (C) Representative confocal slices of induced pluripotent stem cell-derived astrocytes (iAstros) transfected with APOE3-mEm and labeled for LDs with BODIPY 665/676. Under baseline media conditions, ∼49.3% of iAstros have APOE on LDs, while 50.7% of iAstros do not have APOE on LDs. Scale bar, 10 µm. (D) Quantification of total LD area per cell in iAstros that do not exhibit APOE on LDs versus iAstros that have LD-associated APOE. LD localization of APOE correlates with LD abundance. N = 54–55 cells per condition. Data were collected and pooled from three biologically independent experiments. (E) Representative confocal slices of human microglial HMC3 cells transfected with APOE3-mEm and labeled for LDs with BODIPY 665/676. Under baseline media conditions, ∼41.6% of HMC3 cells have APOE on LDs, while 58.4% of HMC3 cells do not have APOE on LDs. Scale bar, 10 µm. (F) Quantification of total LD area per cell in HMC3 cells that do not exhibit APOE on LDs versus HMC3 cells that have LD-associated APOE. LD localization of APOE correlates with LD abundance. N = 44–54 cells per condition. Data were collected and pooled from three biologically independent experiments. (G) TRAE3-H cells loaded with oleic acid (OA), linoleic acid (LA), or arachidonic acid (ARA), fixed, and stained for endogenous APOE and LDs with BODIPY 493/503. Each fatty acid stimulated LD biogenesis and APOE trafficking to LDs in TRAE3-H cells. Scale bar, 20 µm (field), 10 µm (single cell). (H) Percentage of TRAE3-H cells loaded with OA, LA, or ARA with APOE on the surface of LDs. Each data point represents the percentage of 50 randomly selected cells from one independent experiment with APOE on the surface of LDs. There is no significant difference in APOE trafficking among the different fatty acid loading conditions. P values for B and P values for D and F were calculated using a Wilcox rank sum test. **** P <0.0001.

