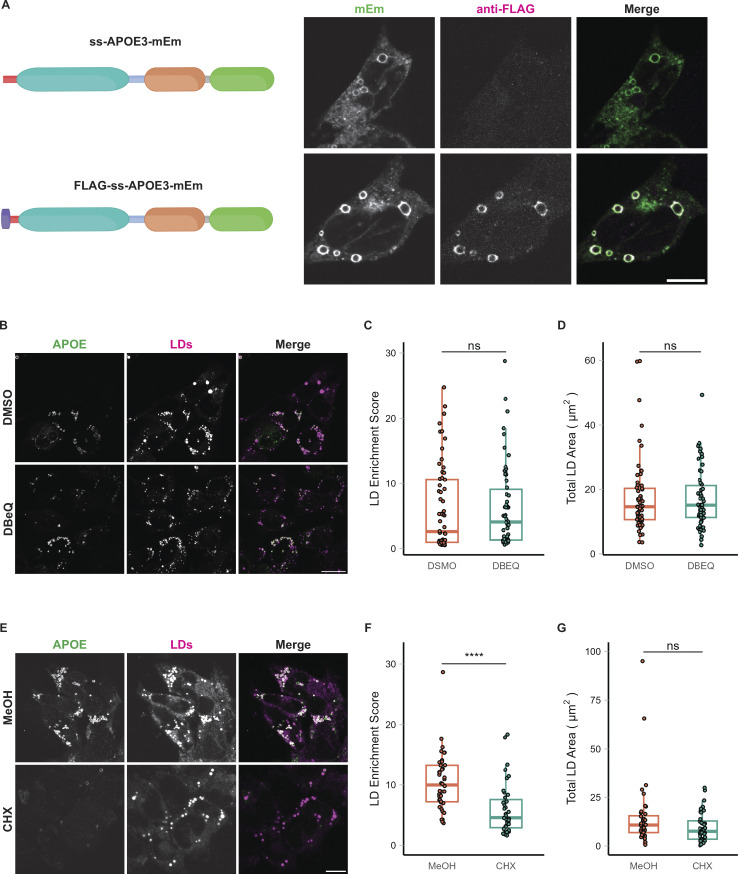
Figure S3.
LD-associated APOE retains its signal peptide and is not retrotranslocated from the ER. (A) Construct design and representative confocal slices of TRAE3-H cells transfected with APOE3-mEm or FLAG-SS-APOE3-mEm and treated with 400 µM OA for 5 h. Cells were then fixed and stained for the FLAG tag with an anti-FLAG antibody. Fluorescence signal on the surface of LDs is positive for both FLAG and mEmerald, indicating that LD-associated APOE retains its N-terminal signal peptide. By contrast, APOE in the secretory pathway is mEm positive but does not stain for FLAG, indicating that the pool of APOE in the secretory pathway is properly processed. Scale bar, 10 µm. (B) Representative confocal slices of TRAE3-H treated with 400 µM OA for 5 h together with 0.1% DMSO vehicle or 10 µM DBeQ. Cells were then fixed and stained for endogenous APOE with an anti-APOE antibody and labeled for LDs with BODIPY 493/503. In the merged image, APOE is in green and LDs are in magenta. Scale bar, 20 µm. (C) The LD enrichment fraction from B was calculated as described in Fig. 1. There is no significant difference in LD enrichment upon DBeQ-treatment, indicating that p97-dependent retrotranslocation is not required for LD-targeting of APOE. (D) Quantification of the total area of BODIPY 493/503-labeled LDs per cell from B. There is no significant difference in the total LD area per cell after DBeQ treatment, indicating that DBeQ does not measurably impact OA-induced LD biogenesis. (E) Representative confocal slices of TRAE3-H slices treated with 400 µM OA for 5 h together with 0.1% MeOH vehicle or 100 µg/ml cycloheximide. Cells were then fixed and stained for endogenous APOE with an anti-APOE antibody and labeled for LDs with BODIPY 493/503. In the merged image, APOE is in green, and LDs are in magenta. Scale bar, 10 µm. (F) The LD enrichment fraction from E was calculated as described in Fig. 1. There is a significant reduction in APOE on LDs upon cycloheximide treatment, suggesting that LD-associated APOE is newly translated. (G) Quantification of the total area of BODIPY 493/503-labeled LDs per cell from E. There is also no significant difference in the total LD area per cell after cycloheximide treatment, indicating that cycloheximide does not measurably impact OA-induced LD biogenesis. (B–G) N = 50 cells per condition. Data were collected and pooled from three biologically independent experiments. Scale bars, 10 µm. ns, P > 0.05, **** P < 0.0001. P values were calculated using a Wilcox rank sum test.

