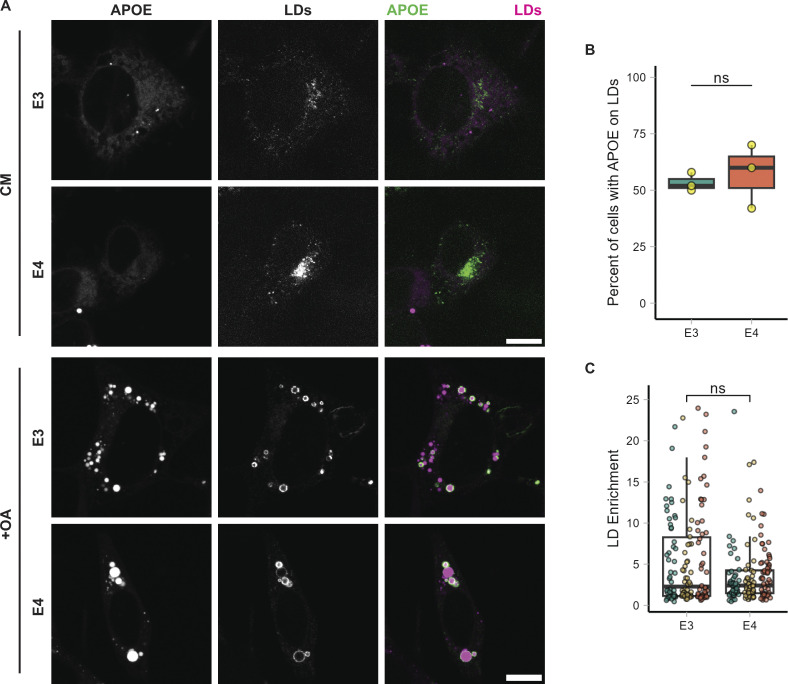
Figure S4.
Targeting to LDs is unaffected in APOE4. (A) Representative confocal images of TRAE3-H cells or TRAE4-H cells with or without 5 h of OA loading. Cells were fixed and stained for endogenous APOE with anti-APOE antibody and for LDs with BODIPY 493/503. In merged images, APOE is in green, and LDs are in magenta. Scale bars, 10 µm. CM, complete media. +OA, 400 µM OA for 5 h. (B) Percentage of TRAE3-H or TRAE4-H cells with APOE on the surface of LDs after 5 h of OA. Each data point is the percentage of cells from 10 random fields of view with APOE on LDs in one experiment. APOE localization to LDs was determined qualitatively. N = 3 biologically independent experiments with 50 cells per experiment. ns, P >0.05. P value was calculated using an unpaired, two-sample t test. (C) LD enrichment fraction of TRAE3-H or TRAE4-H cells treated with OA for 5 h. LD enrichment fraction was calculated as described in Fig. 1. N = 50 cells per condition and experiment. Each data point represents one cell, and each color represents data collected from a separate, independent experiment. These are the same cells used in B, but LD enrichment was measured using an unbiased quantitative method rather than being assessed qualitatively. ns, P > 0.05. P value was calculated using a clustered Wilcox rank sum test via the Rosner–Glynn–Lee method.

