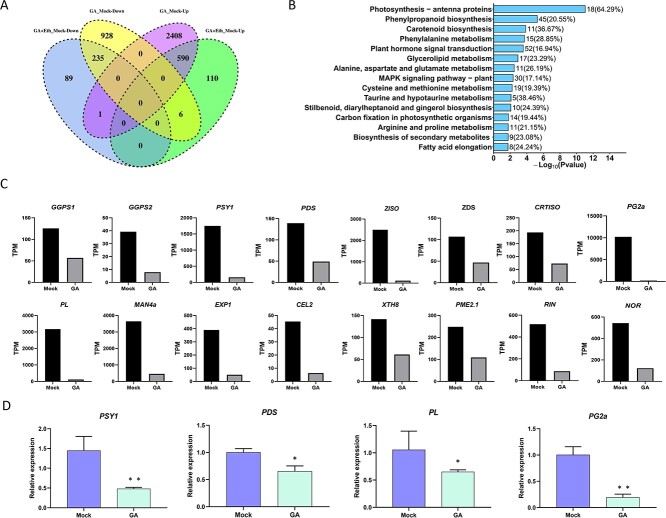
Figure 6.
RNA-seq profiling of tomato fruits with different treatments. A Venn diagram of differentially expressed genes (DEGs). The intersection of downregulated and upregulated genes that exhibited differential expression under GA and GA + Eth treatment compared to mock treatment. B KEGG analyses of DEGs between mock and GA treatment. C Expression levels of carotenoids and softening-related genes in transcripts per million. D RT–qPCR analysis of the expression level of genes related to ripening. The mRNA levels of each gene in the mock sample were standardized to 1. The error bars represent the standard errors.

