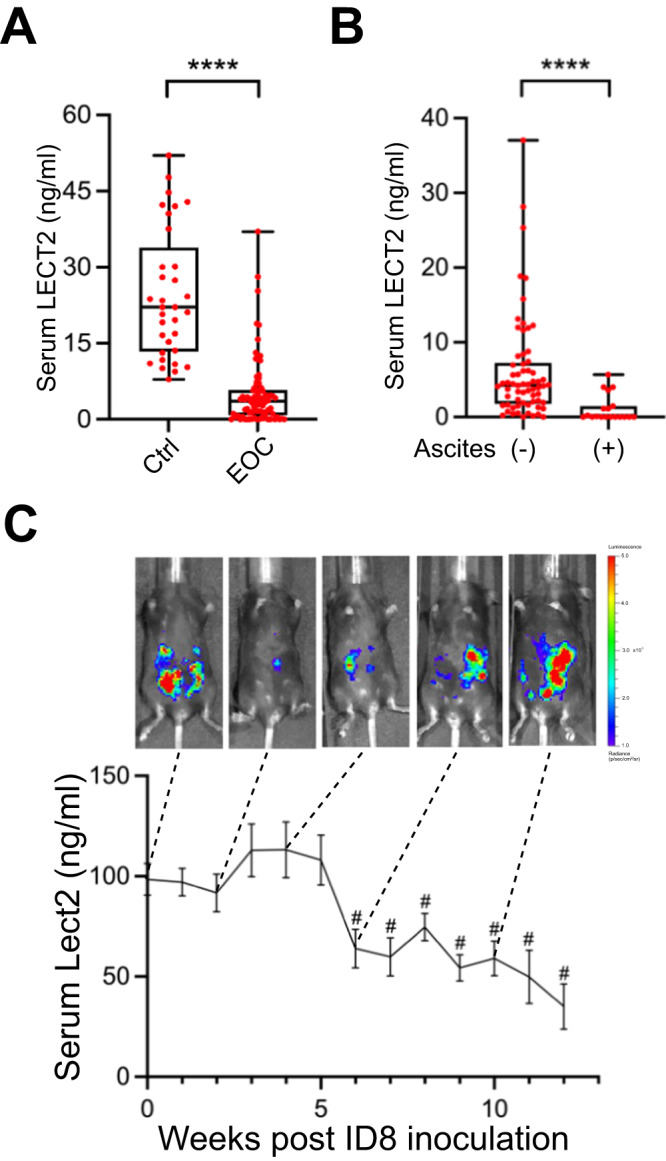
Fig. 1. In vivo LECT2 concentration of EOC.

A Comparison of serum levels of LECT2 protein in EOC (n = 84) and healthy women (n = 33). ****P < 0.0001. B The LECT2 level in EOC patients with malignant ascites (n = 19) and without detectable ascites (n = 65). ****P < 0.0001. C Serial detection of Lect2 in the intraperitoneal ID8/luciferase mice model. A drop in serum Lect2 level was measured after week 6, as shown in representative pictures of increased peritoneal luminescence. #P < 0.0001.
