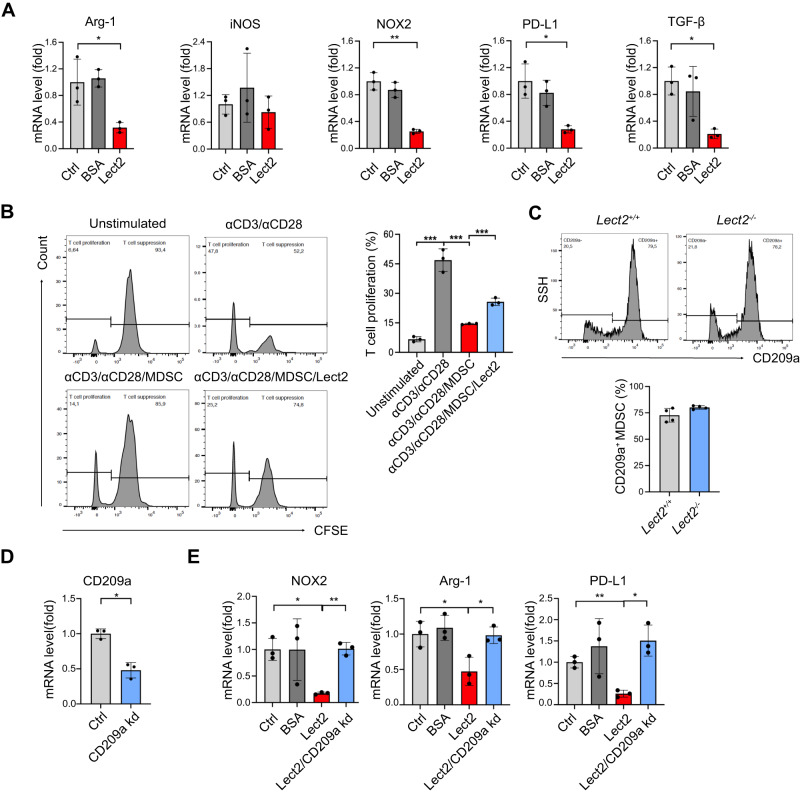
Fig. 7. Lect2 altered gene expression of MDSC via the CD209a receptor.
A The mRNA fold change by qPCR of the immunosuppressive profile in MDSCs after 96 h of in vitro stimulation with Lect2 (160 ng/ml). *P < 0.05 and **P < 0.01. B The representative histograms (left) from flow cytometry analysis show the CFSE intensity of CD8 T cells in different treatment groups. Bar graphs (right) show CD8 T-cell proliferation. An anti-CD3/anti-CD28-stimulated T cell without MDSC co-culture was used as a control. The stimulated T cells were co-cultured with MDSC (1:2) in the presence of Lect2 (80 ng/ml) or not. C The histogram from flow cytometry analysis and bar graphs showing CD209a expression in splenic MDSCs of Lect2−/− or Lect2+/+ mice. D Q-PCR validation of the CD209a knockdown (CD209a kd) of the MDSCs in vitro. E The mRNA fold change of intracellular immune-suppressive mediators (NOX-2, Arg-1, and PD-L1) in MDSCs treated with control, BSA (80 ng/ml), Lect2 (80 ng/ml), and Lect2 in CD209a knockdown groups (each group n = 3).

