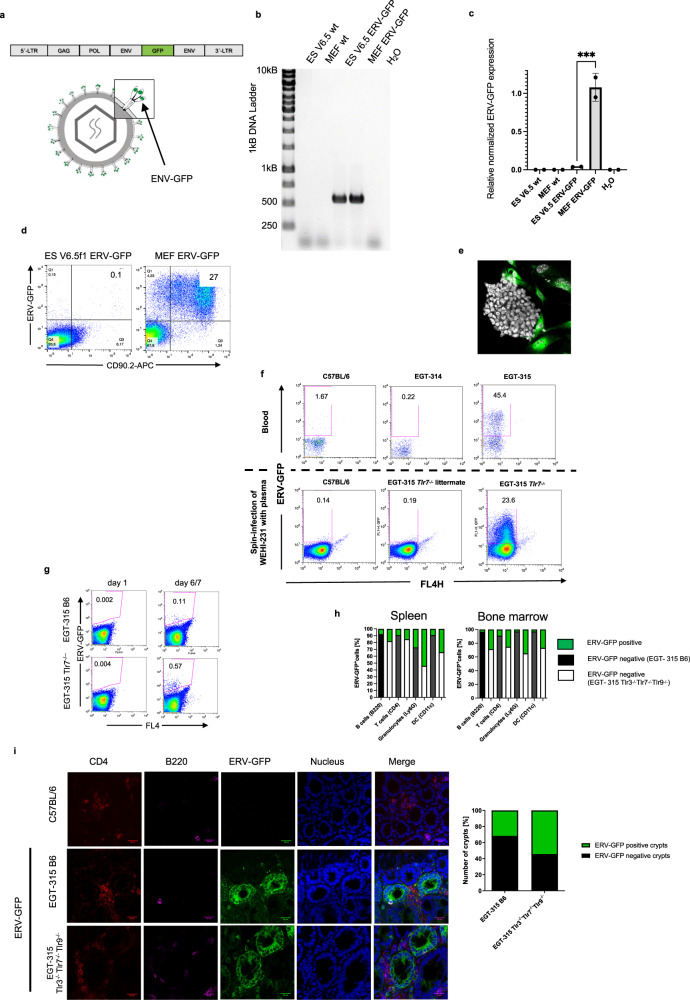
Fig. 1. Generation and expression of ERV-GFP in the mouse strain EGT-315.
a Schematic genome and virus structure of ERV-GFP Mo-MuLV. Magnification: env-GFP fusion protein (green). b Detection of ERV-GFP by PCR in genomic DNA of embryonic stem (ES) cells and mouse embryonic fibroblasts (MEFs). c Expression of ERV-GFP RNA transcripts analyzed by Q-PCR in MEFs and ES cells. Single aliquots of uninfected (wt) and ERV-GFP infected ES cells and MEFs were tested. Duplicate measurements ES V6.5 ERV-GFP mean = 0.039 (technical replication), SD = 0,004 and MEF ERV-GFP, mean = 1.1, SD = 0.18 (technical replication). Statistics of technical replication with ordinary one-way ANOVA, ***p = 0.0003. d ERV-GFP protein detection by flow cytometry. Anti-CD90.2 staining was used to differentiate ES cells from MEF feeder cells in co-culture. e Microphotograph of ERV-GFP infected ES-cell colony and MEFs. ERV-GFP (green; feeder cells) and nuclear counterstaining with DAPI (gray; all cells). f Flow cytometry for ERV-GFP expression in blood from 3-week old founder mouse EGT-315 backcrossed to C57BL/6 background and negative controls (C57BL/6 and EGT-314 non-transgenic founder, upper row). Example of in vitro infection assay of WEHI-231 cells by plasma of EGT-315 Tlr7−/− mice (genotype: Tlr3+/-Tlr7−/−Tlr9+/-) (5 positive of n = 6) and EGT-315 wild type Tlr7−/− littermates (n = 3) and C57BL/6 (n = 3) (lower row). g Representative flow cytometry of neonatal ERV-GFP activation in spleen, on day 1 and day 6 and 7 in EGT-315 C57BL/6 (n = 0/2 on day 1 and 3/3 on day 6) and EGT-315-Tlr7−/− mice (genotype: Tlr3+/- Tlr7−/− Tlr9+/-) (n = 0/2 and 4/6 on day 7). h Flow cytometry of cell type-specific expression of ERV-GFP in cells of spleen and bone marrow of F1-4 EGT-315 B6 mice (black bars, n = 5) as well as EGT-315-Tlr3−/−Tlr7−/−Tlr9−/− mice (white bars, n = 5). Green indicates the percentage of ERV-GFP+ cells relative to 100% of the cell type. EGT-315 B6 Spleen: B cells (mean = 7.6, SD = 4.3), T cells (mean = 9.2, SD = 7.5), Granulocytes (mean = 27, SD = 14.1), DCs (mean = 9, SD = 4.2). EGT-315 B6 bone marrow: B cells (mean = 3.2, SD = 2.4), T cells (mean = 8.9, SD = 9.3), Granulocytes (mean = 2.8, SD = 2.5), DCs (mean = 2.8, SD = 0.042). EGT-315 Tlr3−/−Tlr7−/−Tlr9−/− spleen: B cells (mean = 17.7, SD = 5.7), T cells (mean = 15, SD = 6.3), Granulocytes (mean = 54, SD = 21.2), DCs (mean = 34, SD = 16.8). EGT-315 Tlr3−/−Tlr7−/−Tlr9−/− bone marrow: B cells (mean = 28.5, SD = 13.6), T cells (mean = 25, SD = 0.31), Granulocytes (mean= 34.6, SD = 4.7), DCs (mean = 26.6, SD = 11.3). i Confocal microphotograph from small intestine of 2.5-month old mice F1-4; helper T cells (CD4), B cells (B220) and nuclei (DAPI). GFP signal indicates ERV-GFP expression. Intestines of 2.5-month old mice representative for C57BL/6 mice (n = 4), EGT-315 B6 mice (n = 4), and EGT-315 Tlr3−/−Tlr7−/−Tlr9−/− mice (n = 6). Scale bar 20 µm. Right pannel, summary of ERV-GFP positive crypts (green) compared to negative crypts (black) from generations F1-4 EGT-315 B6 mice (n = 4), and EGT-315 Tlr3−/−Tlr7−/−Tlr9−/− mice (n = 5). EGT-315 B6 31,7% (83 GFP+ crypts of 262) and EGT-315 Tlr3−/−Tlr7−/−Tlr9−/− mice 54,3% (139 GFP+ crypts of 256). Source data are provided as a Source Data file.

