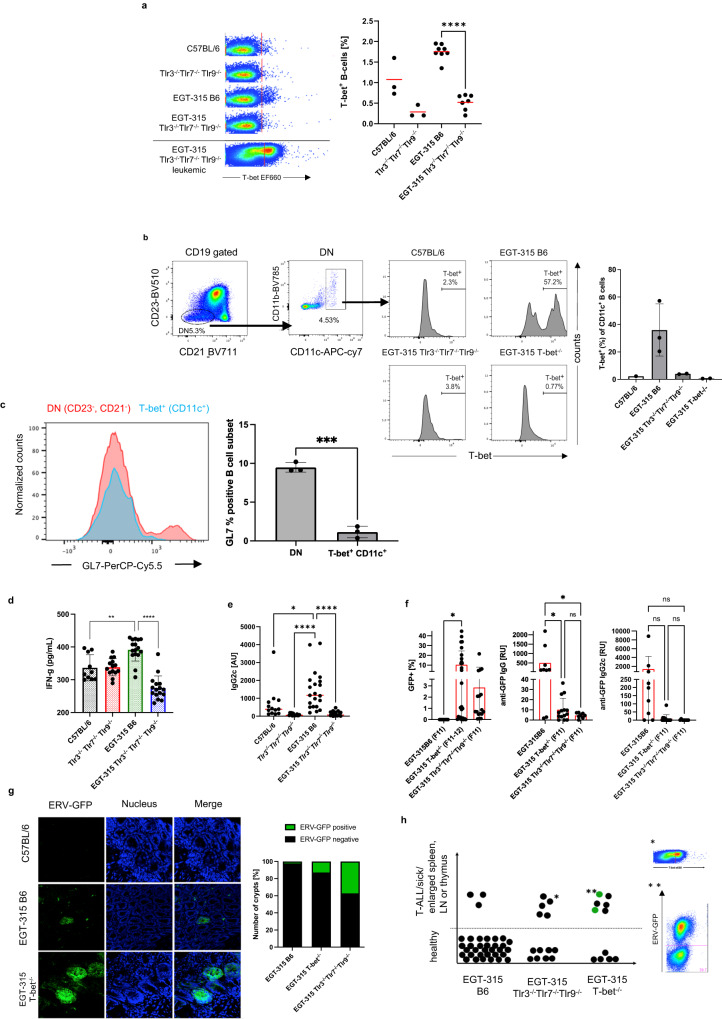
Fig. 5. ERV-GFP recognition results in upregulation of IFN-γ, IgG2c, increases T-bet+ ABCs and is dependent on T-bet.
a T-bet positive B cells identified by intracellular flow cytometry. Left, examples of dot plot analysis of the four genotypes, red line demarcates T-bet negative vs positive cells. Lower example, cells of a leukemic EGT-315 Tlr3−/−Tlr7−/−Tlr9−/− mouse. Right, summary of % T-bet+ cells of individual mice: C57BL/6 (mean = 1.07, SD = 0.463, n = 3), Tlr3−/−Tlr7−/−Tlr9−/− (mean = 0.29, SD = 0.15, n = 3), EGT-315 B6 (mean = 1.75, SD = 0.189, n = 8), EGT-315 Tlr3−/−Tlr7−/−Tlr9−/− (mean = 0.52, SD = 0.19, n = 7). EGT-315 B6 vs. EGT-315 Tlr3−/−Tlr7−/−Tlr9−/− ****P < 0.0001. Ordinary one way ANOVA multiple comparisons test. Summary of 5 experiments. b ABCs in EGT-315 B6 mice. Gating strategy of CD19+ splenic B cells from C57BL/6 (2.3, n = 1), EGT-315 B6 (mean = 35.97, SD = 19.1, n = 3), EGT-315 TLR3−/−TLR7−/−TLR9−/− (mean = 4.0, SD = 0.33, n = 2) and EGT-315 T-bet−/− mice (mean = 0.67, SD = 0.15, n = 2). DN defines CD23- CD21- B cells. Box in DN panel defines both CD11c+ CD11b+ and CD11c+ CD11b- B cells analyzed for T-bet expression. Right panel, summary of mice tested for % T-bet positive CD11c+ cells. c Overlay of histogram for GL7 of DN (red) and T-bet+ CD11c+ ABC population (blue) of EGT-315 B6 mice (n = 3). GL7 positive B cells are present in the DN B cell population but not in the ABC population in spleen of individual EGT-315 B6 mice. DN (mean = 9.48 SD = 0.627, n = 3), T-bet+ CD11c+ ABC (mean = 1.14 SD = 0.752, n = 3), ***P = 0.0002. Unpaired Two-tailed t-test with Welch´s correction. d Serum IFN-γ levels in pg/ml measured by cytometric bead array for mouse inflammatory cytokines in individual sera of C57BL/6 (black bar, mean = 337, SD = 40, n = 10), Tlr3−/−Tlr7−/−Tlr9−/− (red bar, mean = 338, SD = 26, n = 14), EGT-315 B6 (green bar, mean = 392, SD = 34, n = 16), EGT-315 Tlr3−/−Tlr7−/−Tlr9−/− (blue bar, mean = 275, SD = 37, n = 16). For statistics a Two-tailed Mann–Whitney U-test was applied. EGT-315 B6 vs. C57BL/6 **P = 0.0029, EGT-315 B6 vs. EGT-315 Tlr3−/−Tlr7−/−Tlr9−/− ****P < 0.0001. Experiment is a summary of two experiments. e Serum IgG2c levels measured by IgG2c-specific ELISA in aribitrary units (AU) in C57BL/6 (mean = 683, SD = 918, n = 13), Tlr3−/−Tlr7−/−Tlr9−/− (mean = 83, SD = 62, n = 14), EGT-315 B6 (mean = 1442, SD = 1088, n = 21). EGT-315 Tlr3−/−Tlr7−/−Tlr9−/− (mean = 121, SD = 120, n = 23) mice. C57BL/6 vs EGT-315 B6 *P = 0.0186; Tlr3−/−Tlr7−/−Tlr9−/− vs EGT-315 B6 ****P < 0.0001; EGT-315 B6 vs EGT-315 Tlr3−/−Tlr7−/−Tlr9−/− ****P < 0.0001. Ordinary one-way ANOVA Tukey´s multiple comparisons test. Summary of 3 experiments. f ERV-GFP expression and anti-GFP antibody response in EGT-315 T-bet−/− mice. Flow cytometry of generation matched (F11-F12) EGT-315 B6 mice (mean = 0, SD = 0, n = 9) EGT-315 T-bet−/− (mean = 10.5, SD = 14.1, n = 26) and EGT-315 Tlr3−/−Tlr7−/−Tlr9−/− mice (mean = 2.9, SD = 5.2, n = 17). % GFP positive cells in PBMC of 3-week old mice (left panel). EGT-315 B6 vs EGT-315 T-bet−/− *P = 0.0327. 10 out of 26 mice (38.5%) of the EGT-315 T-bet−/− mice display very high ERV-GFP expression (>10%). Red bars are mean values. Statistics with Ordinary one-way ANOVA Tukey´s multiple comparisons test. Summary of 3 experiments. Anti-GFP IgG (middle) EGT-315 B6 mice (mean = 504, SD = 773, n = 9) EGT-315 T-bet−/− (mean = 10.2, SD = 11.3, n = 14) and EGT-315 Tlr3−/−Tlr7−/−Tlr9−/− mice (mean = 4.5, SD = 2.5, n = 8). EGT-315 B6 vs EGT-315 T-bet−/− *P = 0.0242; EGT-315 B6 vs EGT-315 Tlr3−/−Tlr7−/−Tlr9−/− *P = 0.0485; EGT-315 T-bet−/− vs EGT-315 Tlr3−/−Tlr7−/−Tlr9-/- nsP = 0.9995; Statistics with Tukey´s multiple comparisons test. Anti-GFP IgG2c (right panel) response of 2–3 month old mice measured by ELISA. EGT-315 B6 mice (mean = 1374, SD = 2873, n = 9) EGT-315 T-bet−/− (mean = 9.3, SD = 24.3, n = 14) and EGT-315 Tlr3−/−Tlr7−/−Tlr9−/− mice (mean = 1, SD = 3, n = 8). All nsP-values > 0.1. Summary of 2 experiments. g Confocal microphotograph from small intestine. GFP signal indicates ERV-GFP expression. Intestines of 2.5-month old mice representative for C57BL/6, EGT-315 B6 and EGT-315 T-bet−/− mice. Right, summary of ERV-GFP positive crypts (green) compared to negative crypts (black) EGT-315 B6 mice (2.2% GFP+, total crypts analyzed 792 of n = 21), EGT-315 T-bet−/− (12.8% GFP+, total crypts analyzed 601 of n = 9) and EGT-315 Tlr3−/−Tlr7−/−Tlr9−/− mice (37.2% GFP+, total crypts analyzed 487 of n = 16). Summary of 4 experiments. h EGT-315 T-bet−/− mice succumb to T-ALL. Summary of mice analysed: EGT-315 B6 (3/34, 8.8%). EGT-315 Tlr3−/−Tlr7−/−Tlr9−/− (5/13, 38%). EGT-315 T-bet−/− (6/11, 55%). The mice examined were 7 month or older. Each dot represents a single mouse. *T-ALL cells from an EGT-315 Tlr3−/−Tlr7−/−Tlr9−/− mouse show increased T-bet expression. **Two out of six lymphomas of EGT-315 T-bet−/− mice were ERV-GFP positive (green dots). Source data are provided as a Source Data file.

